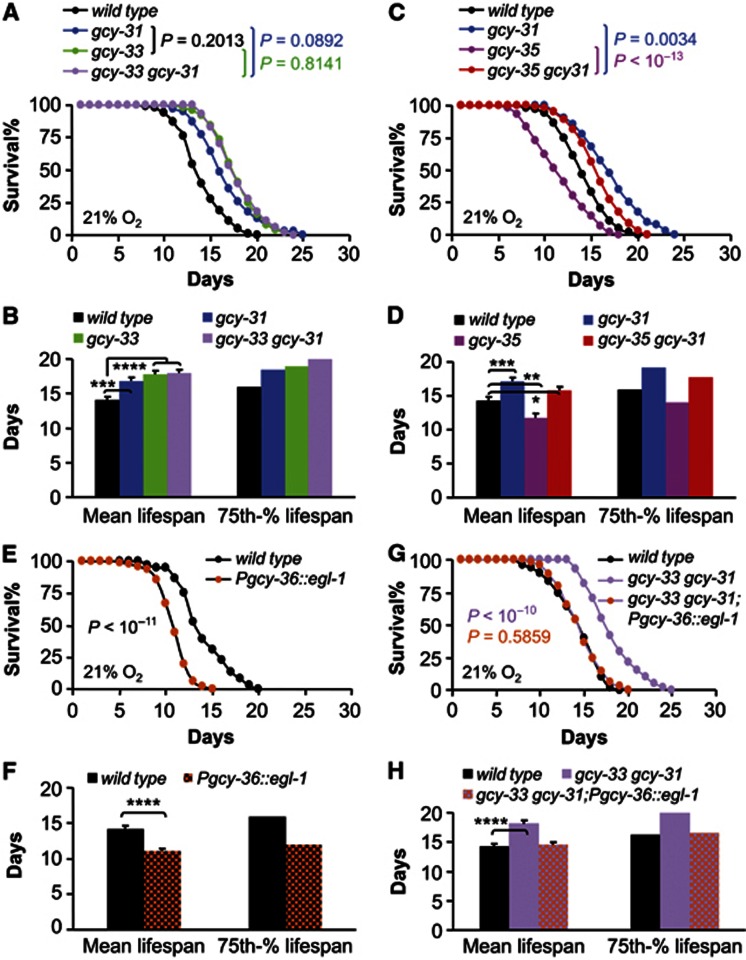
Figure 4.
Interaction of low O2-sensing and high O2-sensing pathways in lifespan control. Survival curves (A, C, E and G) and mean lifespan and 75th percentile lifespan (B, D, F and H) of wildtype controls versus gcy-31(ok296) mutants (Mantel-Cox P<10−5), gcy-33(ok232) mutants (Mantel-Cox P<10−13), and gcy-33(ok232); gcy-31(ok296) double mutants (Mantel-Cox P<10−25) (n=39–140 per genotype) (A, B), of wildtype controls versus gcy-31(ok296) mutants (Mantel-Cox P<10−5), gcy-35(ok769) mutants (Mantel-Cox P<10−4), and gcy-35(ok769); gcy-31(ok296) double mutants (Mantel-Cox P<10−3) (n=40–103 per genotype) (C, D), of wildtype controls versus animals with genetic ablation of URX, AQR, and PQR neurons (n=36–140 per genotype) (E, F), and of wildtype controls versus gcy-33(ok232); gcy-31(ok296) mutants, and gcy-33(ok232); gcy-31(ok296) mutants with genetic ablation of URX, AQR, and PQR neurons (Mantel-Cox P<10−12 compared to gcy-33 gcy-31 double mutants) (n=48–115 per genotype) (G, H). (A, C, E and G) show animals pooled from multiple independent experiments; (B, D, F and H) show analysis from a representative single experiment (n=26–48 per group). *P<0.05, **P<0.01, ***P<0.001, ****P<0.0001, statistics for curve comparisons are shown in the figure. Error bars represent mean±s.e.m.

