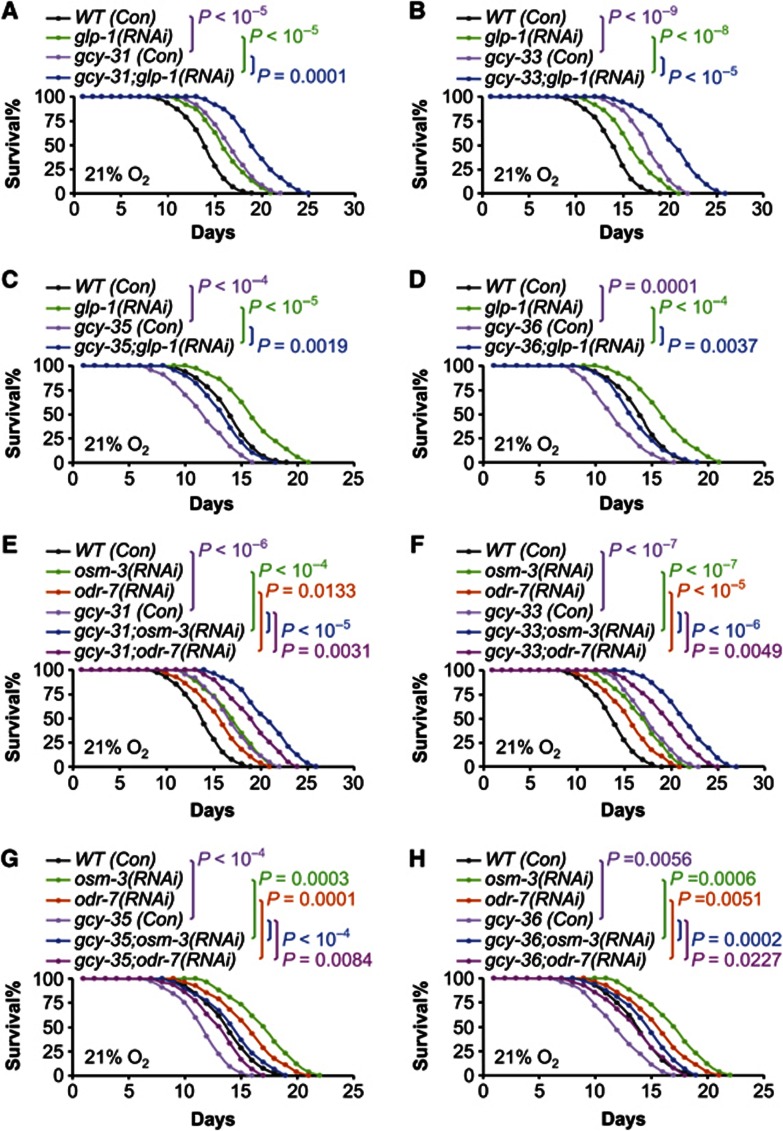
Figure 6.
GCYs modulate lifespan independently of germline signalling or sensory perception. (A–D) Survival curves of N2 wildtype (WT) strain versus gcy-31(ok296) (A), gcy-33(ok232) (B), gcy-35(ok769) (C), or gcy-36(db66) (D) mutants treated with glp-1(RNAi) or control RNAi (Con). All experiments in (A–D) were performed at the same time, and the same groups of WT (Con) and glp-1(RNAi) were compared to individual gcy mutants. (E–H) Survival curves of N2 WT strain versus gcy-31(ok296) (E), gcy-33(ok232) (F), gcy-35(ok769) (G), or gcy-36(db66) (H) mutants treated with osm-3(RNAi), odr-7(RNAi), or control RNAi (Con). All experiments in (E–H) were performed at the same time, and the same groups of WT (Con), osm-3(RNAi), and odr-7(RNAi) were compared to individual gcy mutants. Statistics for curve comparisons are shown in the figure, n=34–48 per group (A–D), n=24–46 per group (E–H). Mean lifespan and 75th percentile lifespan of (A–D) are shown in Supplementary Figure S5, and mean lifespan and 75th percentile lifespan of (E–H) are shown in Supplementary Figure S6.

