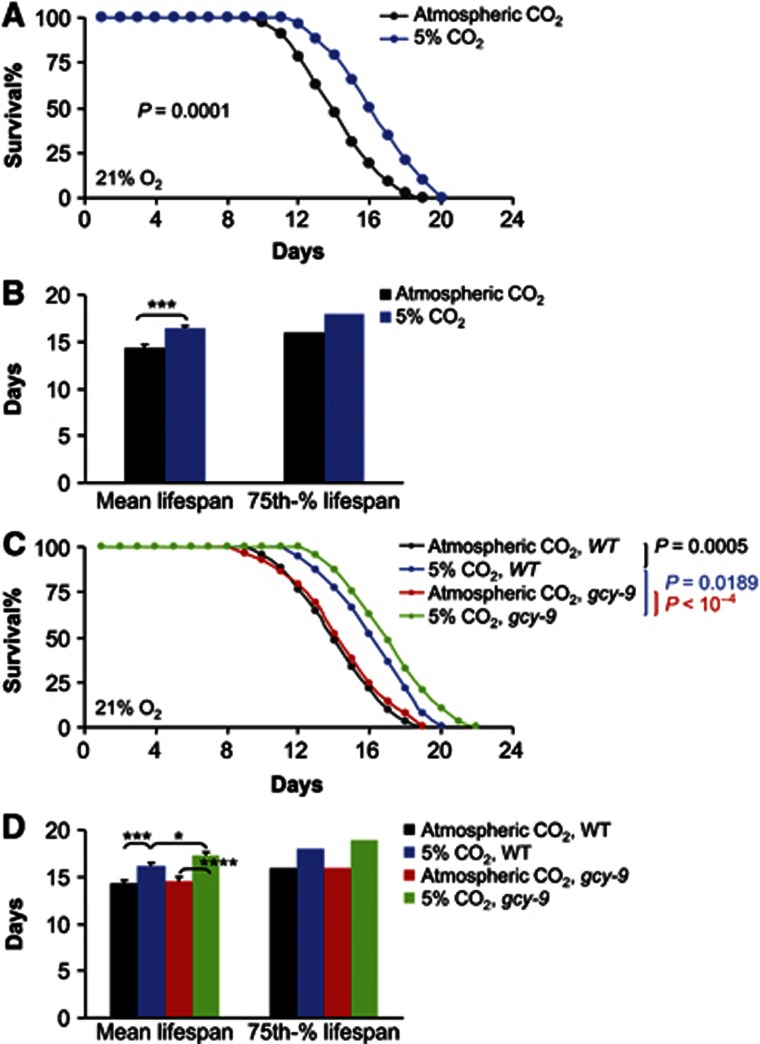
Figure 9.
BAG neurons and GCY-9 counteract CO2-induced lifespan extension. (A, B) Survival curves (A) and mean lifespan and 75th percentile lifespan (B) of wildtype C. elegans under atmospheric CO2 (n=32) versus 5% CO2 (n=52). (C, D) Survival curves (C) and mean lifespan and 75th percentile lifespan (D) of wildtype controls and gcy-9(tm2816) mutants under atmospheric CO2 versus 5% CO2 (n=29–45 per group). *P<0.05, ***P<0.001, ****P<0.0001, statistics for curve comparisons are shown in the figure. Error bars represent mean±s.e.m.

