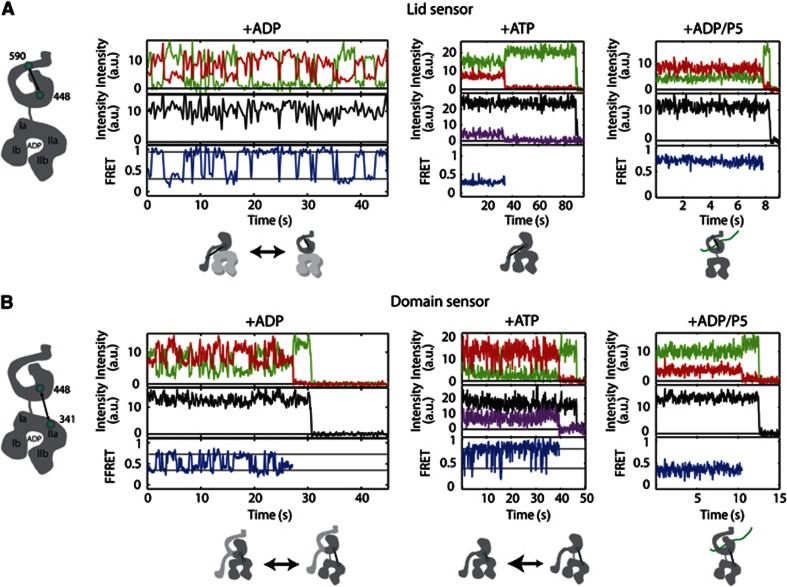
Figure 1.
Representative data from spFRET TIRF experiments. Time traces of the donor and acceptor intensity (upper graphs), total intensity (middle graphs) and FRET efficiency (lower graphs) of the lid sensor (Ssc1(448, 590)) (A) or domain sensor (Ssc1(341, 448)) (B) in the presence of 1 mM ADP (left panels), collected at 250 ms/frame from the lid sensor and 30 ms/frame for the domain sensor, 1 mM ATP (middle panels) at a time resolution of 100 ms/frame, and 1 mM ADP and 5 μM P5 (right panels) at a time resolution of 30 ms/frame. The magenta lines display the total acceptor intensity after direct acceptor excitation (at 633 nm) measured using msALEX (Kapanidis et al, 2005). With the exception of the left panel in (A), all traces show photobleaching of the acceptor molecule, where the acceptor intensity drops to zero along with the concomitant rise in the donor signal, followed by photobleaching of the donor molecule at the end of the trace. Schematic depictions of the labelling positions are shown to the left of each panel and schematic representations of the conformational changes being observed in each spFRET trace are shown below the respective trace.

