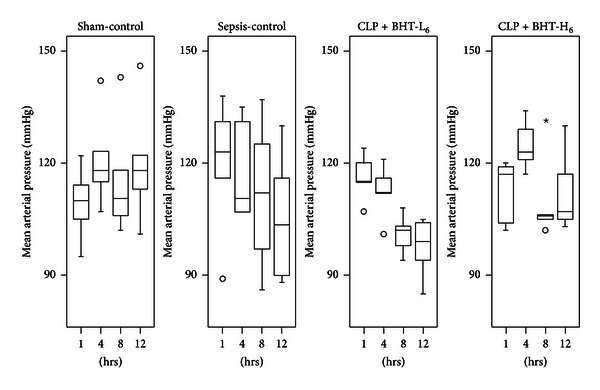
Figure 3.

Effects of Bai-Hu-Tang on mean arterial pressure (MAP). MAP in sham-control, sepsis-control, CLP + BHT-L6, and CLP + BHT-H6 groups at 0, 4, 8, and 12 hours after operation were expressed as the box plots. Boxes denote the 25th and 75th percentile; horizontal lines in the box indicate the median. Outliers are displayed as circles (○) and extreme values as stars (⋆). No significant difference was noted at any time point among the four groups.
