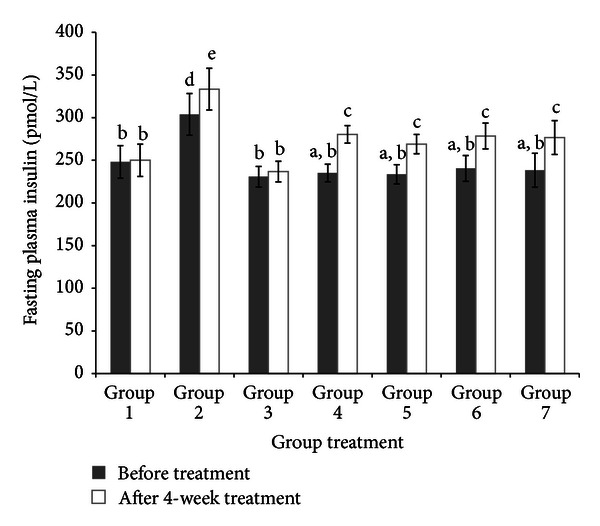
Figure 3.

Fasting plasma insulin before (0 week) and after treatment (4 week). Insulin level of normal rats (Group 1), obese rats (Group 2), diabetic control rats (Group 3), diabetic rats treated with 50 mg/kg bw of C. latifolia fruit:root (Group 4), diabetic rats treated with 100 mg/kg bw of C. latifolia fruit : root (Group 5), diabetic rats treated with 200 mg/kg of C. latifolia fruit:root (Group 6), and diabetic rats treated with 10 mg/kg bw of glibenclamide (Group 7). Columns represent the mean ± SD (n = 6). a,b,csignificantly different at P < 0.05.
