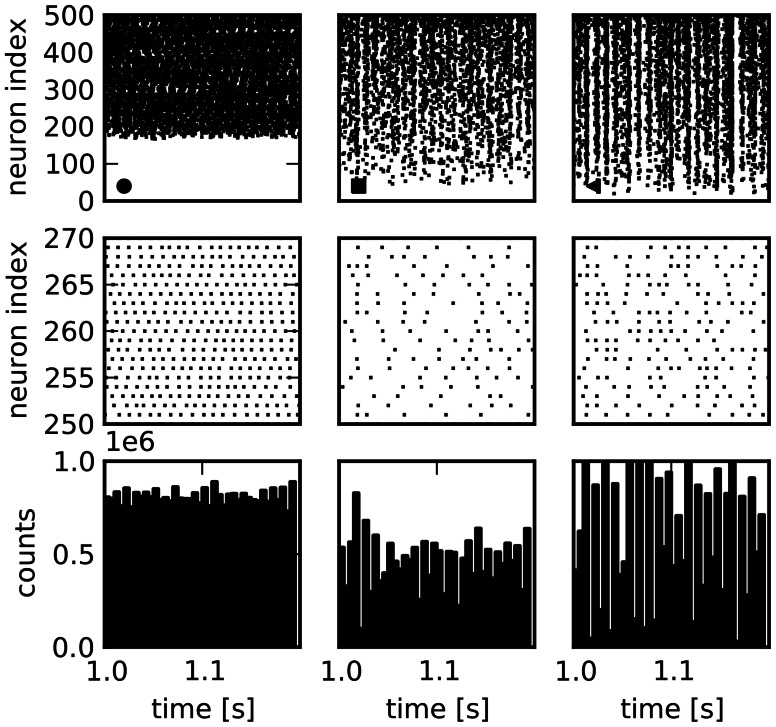
Figure 2.
Spike train raster plots for three network examples. Columns: Activity in three different sample networks. Top row: Raster plots of activity of 500 randomly chosen neurons, sorted according to their firing rate. Middle row: Enlarged view of a smaller number of spike trains. Bottom row: Population activity of all neurons in bins of 5 ms demonstrates differences in total population activity and fluctuations.

