Figure 5.
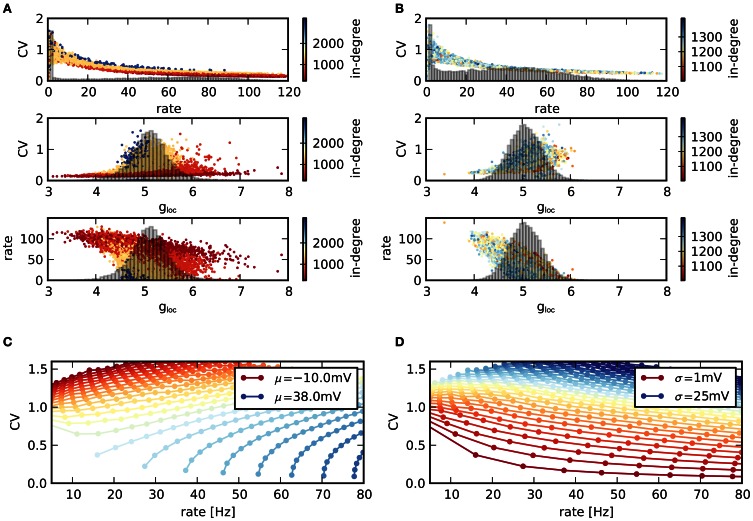
Statistics of individual nodes. (A) (Top) Scatter plot of rates vs. CVs across neurons in a single network with low average CV. Colors indicate the value of the in-degree of neurons. Histogram: distribution of rates in the network. (Middle) Corresponding scatter plot of CVs vs. excitation/inhibition ratio gloc of the single neurons as well as distribution of gloc. (Bottom) Scattered rates vs. gloc. (B) Same as (A), but for network with high average CV. (C,D) Relation between mean firing rate and CV of a single LIF neuron, depending on mean μ and standard deviation σ of voltage fluctuations. The parameters μ, σ denote the mean and standard deviation of the free membrane potential due to input currents. (C) Contours for constant μ and increasing σ (higher rates for higher σ). (D) Same data, but contours drawn for constant σ and increasing μ (higher rates for higher μ). The shape of the CV-rate dependency in neurons within networks [top panels in (A,B)] suggests that high firing rates result from an increase in input mean rather than variance.

