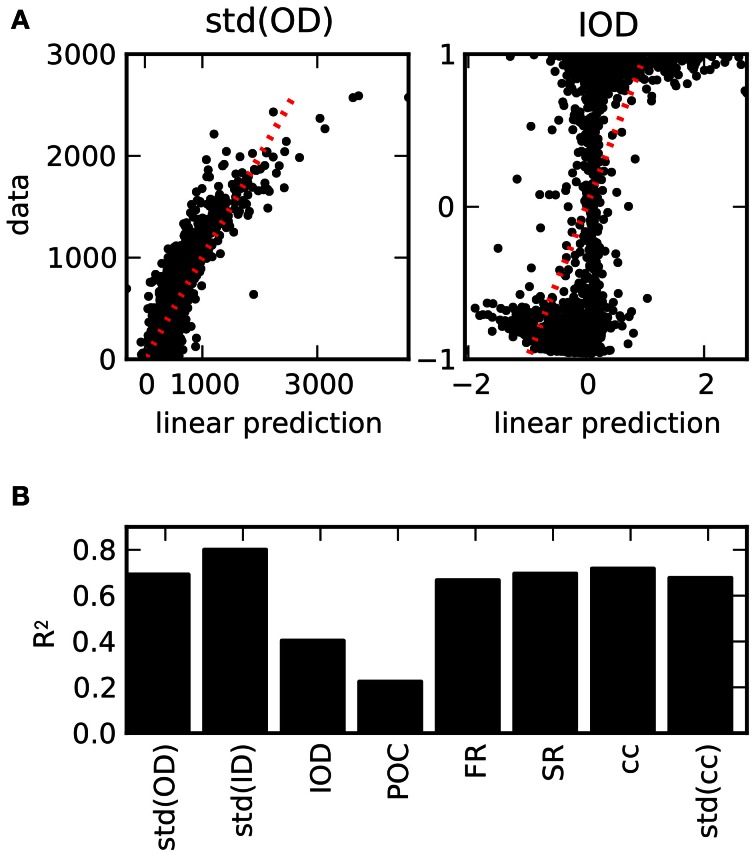
Figure 6.
Prediction of structural features on the basis of activity measures. (A) Examples for the result of a linear regression across all network realizations on the basis of all 12 activity measures considered here (see Table 3). Scatter plot of the predictions from the linear regression against the exact values obtained from the connectivity matrix. (B) R2 values as a measure for the goodness-of-fit of the linear prediction for the full set of structural features (averaged across different divisions in 5-fold cross-validation). Due to the strong dependencies uncovered in the ensemble of networks, structural features can be reasonably well predicted from activity, with the exception of degree correlations.

