
Figure 3.
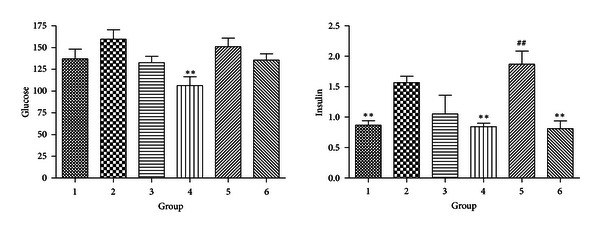
Levels of serum glucose and insulin (*P < 0.05 compared with Group 2. **P < 0.01 compared with Group 2; # P < 0.05 compared with Group 1. ## P < 0.01 compared with Group 1).
Official websites use .gov
A
.gov website belongs to an official
government organization in the United States.
Secure .gov websites use HTTPS
A lock (
) or https:// means you've safely
connected to the .gov website. Share sensitive
information only on official, secure websites.
Levels of serum glucose and insulin (*P < 0.05 compared with Group 2. **P < 0.01 compared with Group 2; # P < 0.05 compared with Group 1. ## P < 0.01 compared with Group 1).