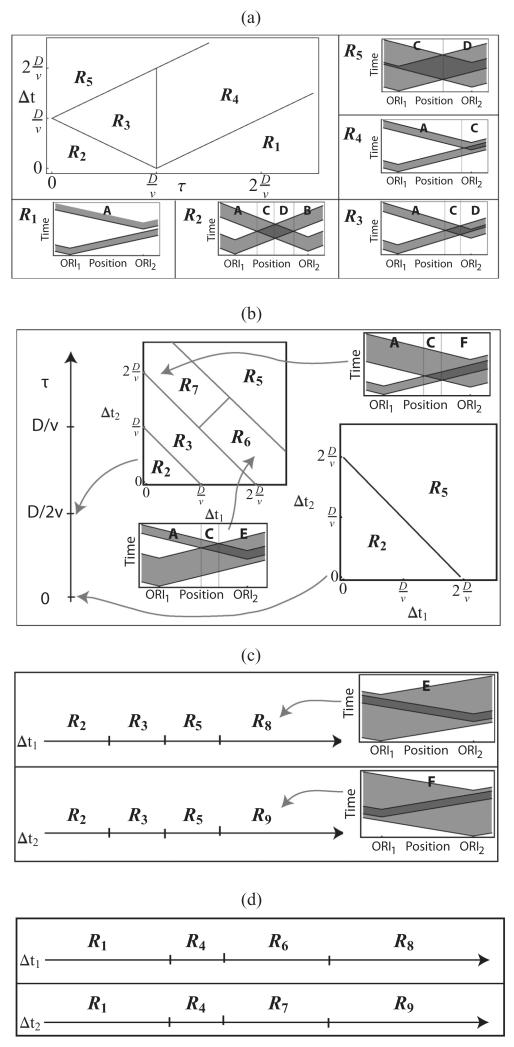
FIG. 6.
Plots showing parameter regime diagrams based on the spatiotemporal dynamics of replication: gray areas indicate where the activation time distribution of origin 1 or 2 has nonzero values, and dark gray regions are where distributions for the two origins overlap. (a) Regimes for Δt1 = Δt2. (b) Some of the regimes for Δt1 ≠ Δt2. (c) Regimes for variable Δt1 (fixed value of Δt2 ≪ D/ν) and Δt2 (fixed value of Δt1 ≪ D/ν) for τ < D/ν. (d) Regimes for variable Δt1 (fixed value of Δt2 ≪ D/ν) and Δt2 (fixed value of Δt1 ≪ D/ν) for τ > D/ν. Parameter values for (c) and (d) where replication dynamics undergoes changes are given in Appendix C.

