
FIGURE 12.
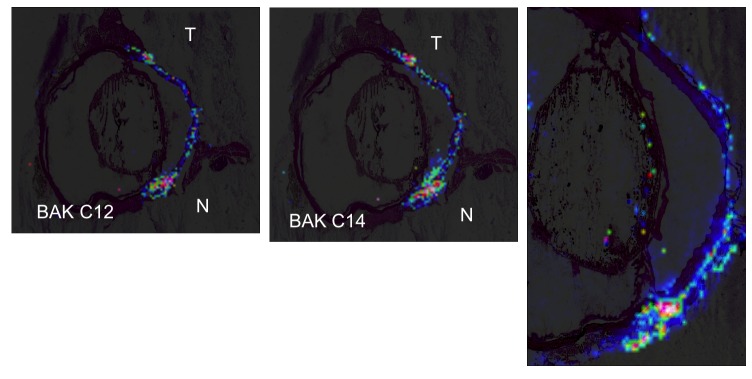
Mass spectrometry imaging of benzalkonium (BAK) distribution after instillation in the rabbit eye. Left, Distribution of BAK C12 after instillation of 0.01% BAK for 5 months. Higher signal levels tend toward red color, lower toward blue. The highest concentrations are found along the ocular surface, with diffusion in the limbal area toward deeper structures, especially in the nasal part of the eye. Spatial resolution of MALDI-ToF MS imaging is 150 μm. Middle, Similar distribution of BAK C14. Right, BAK C14 MS imaging in another rabbit eye showing the same distribution as well as the signal along the anterior capsule of the lens. T, temporal; N, nasal.