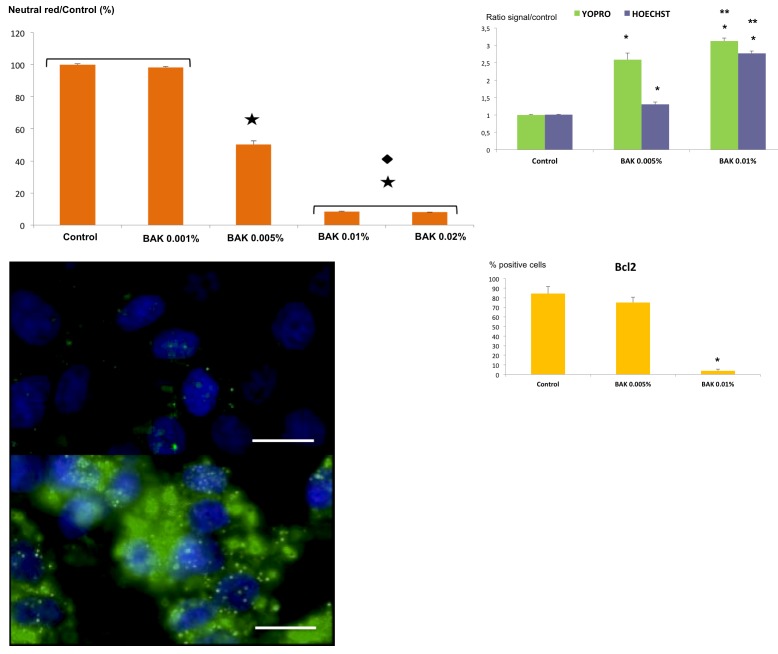
FIGURE 3.
Cell viability and expression of apoptosis-related markers. Top left, Evaluation of cellular viability of benzalkonium (BAK)-treated HTM3 cells using the neutral red test. Results are expressed as the percentage of positive cells reported to the control; ★<.001 vs control. ♦P<.001 vs BAK 0.005% (ANOVA). (Bar = Standare Error.) Top right, Evaluation of apoptosis in BAK-treated HTM3 cells using YO-PRO-1 and Hoechst 33342 tests. Results are expressed as the ratio of signal over the control; *P<.001 vs control; **P<.01 vs BAK 0.005% (ANOVA). (Bar = Standare Error.) Bottom left, Immunofluorescence staining of control (top) or BAK-treated (bottom) HTM3 cells, showing intracellular activated caspase-3 (in green) and nuclei stained with DAPI (in blue). (Bars = 50 μm.) Bottom right, Flow cytometry measurement of the anti-apoptosis molecule Bcl2 in control or BAK-stimulated HTM3 cells. Results are expressed as the percentage of positive cells; *P<.001 vs control and BAK 0.005% (ANOVA). Bar = SE.

