
FIGURE 7.
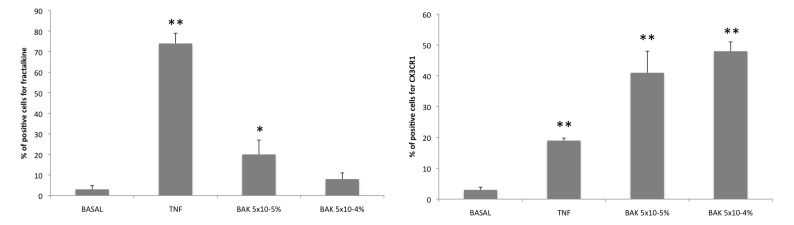
Fractalkine and CXC3CR1 expression in trabecular cells assessed by flow cytometry. Left, Fractalkine expression was low in the basal condition. It was enhanced after TNF-α and benzalkonium (BAK) 5×10⁻⁵% stimulations and was increased but not significantly for BAK 5×10⁻⁴% stimulation. *P<.05; **P<.001 (ANOVA). Right, CX3CR1 expression rate in flow cytometry was also low in basal condition. It was increased after all BAK stimulations in HTM3 cells. **P<.001 (ANOVA). Bars = SE.