
FIGURE 8.
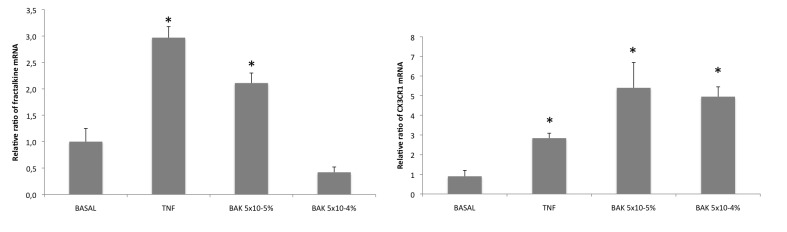
Fractalkine and CXCR3 mRNA levels in trabecular cells assessed by quantitative RT-PCR. Left, Increased fractalkine mRNA level after TNF-α stimulation and after benzalkonium (BAK) 5×10⁻⁵% stimulation compared to basal condition. No significant difference for BAK 5×10⁻⁴%. * P<.05 (ANOVA). Right, statistically significant increase of CX3CR1 mRNA expression after TNF-α and BAK stimulations in TM3 cells. *P<.05 (ANOVA). Bars = SE.