
Figure 2. Expression of Bnip3 and Pdk1 mRNA following hypoxia.
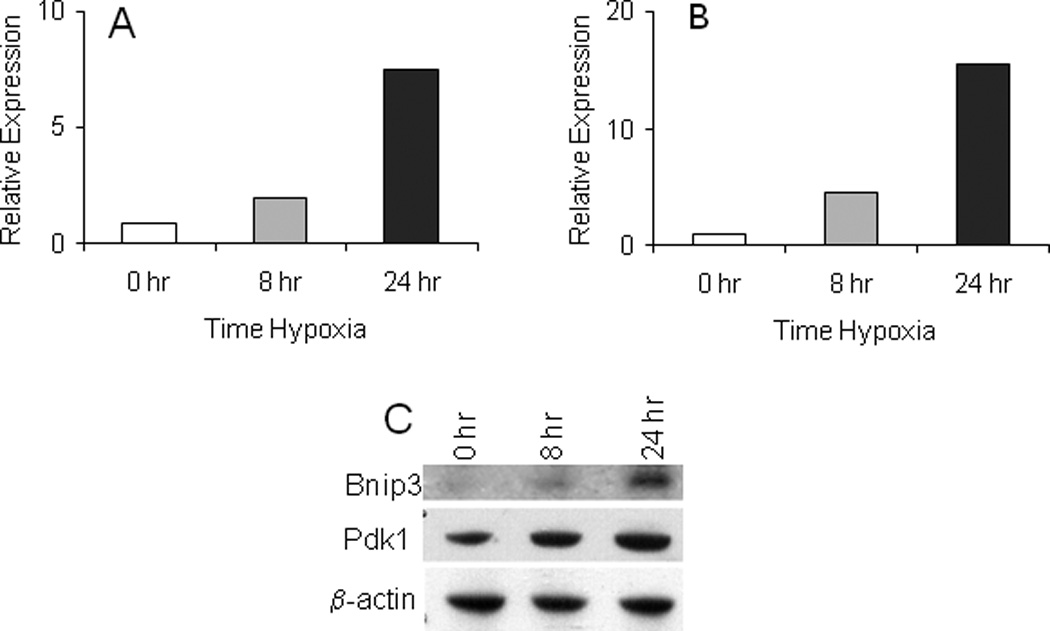
The mRNA transcript levels of Bnip3 (A) and Pdk1 (B) following 0, 8 or 24 hr hypoxia were determined by Taqman real-time PCR. Relative expression was calculated in relation to the expression level of β-actin which was used as the normalization control. The values shown are mean of two observations in one experiment. C. Western blot of Bnip3 and Pdk1 protein expression at 0, 8 and 24 hr; β-actin served as control. For details, see methods section.