
Figure 3. mtDNA gene alteration following hypoxia.
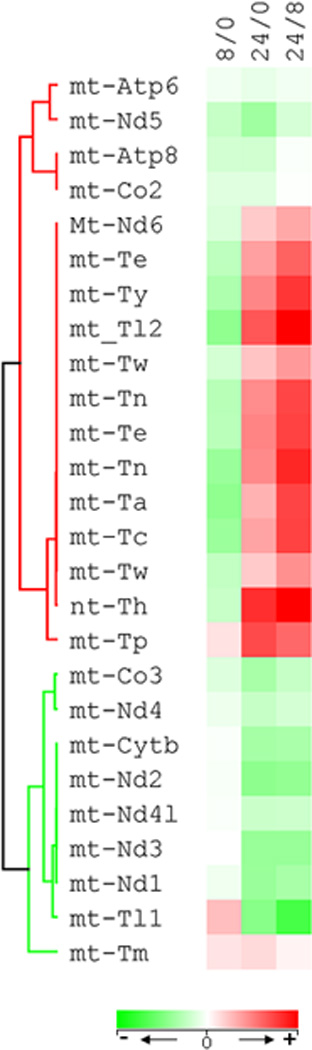
The expression of 26 of the 46 mtDNA transcripts demonstrated significant alteration at one of the three time intervals tested: 0 vs 8 hr (8/0), 0 vs 24 hr (24/0) and 8 hr vs 24 hr (24/8). The heat map illustrates the expression level of these genes in fold changes in relation to normoxic (0 hr hypoxia) condition at 0 hr vs 8 hr and 8 hr vs 24 hr.