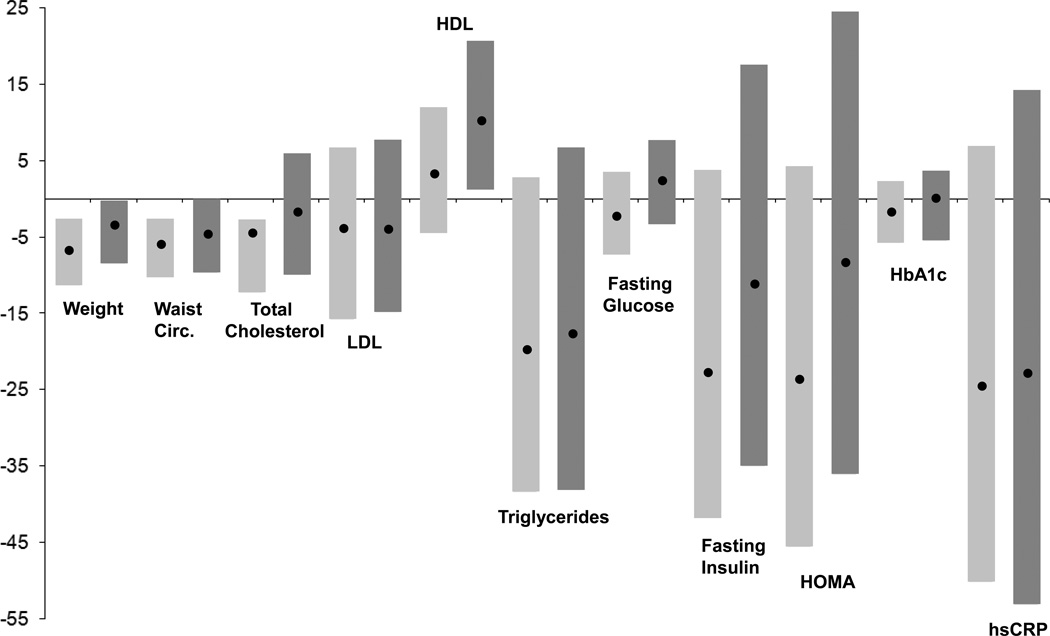
Figure 1.
The median percent change from baseline at 6 months (light gray bars) and 24 months (dark gray bars) among all participants for weight, BMI, waist circumference, total cholesterol, low-density lipoprotein, high-density lipoprotein, triglycerides, fasting glucose, fasting insulin, HOMA, HbA1c, and hsCRP. The dot represents the medians, and the bars show the range from the 25th to the 75th percentile.

