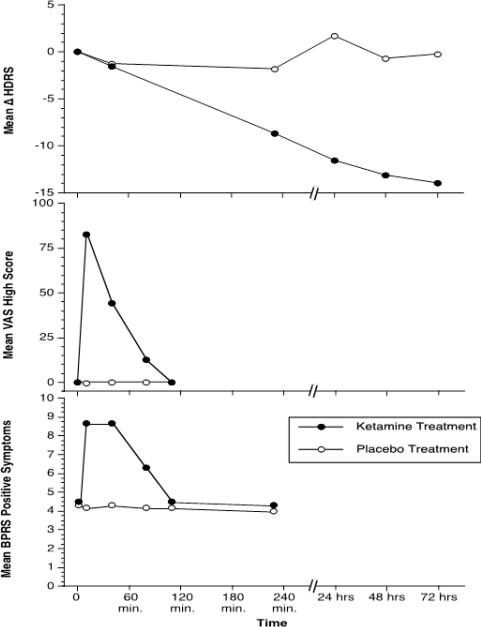
Figure 1.
The effects of ketamine 0.5 mg/kg, i.v. and a saline placebo in patients with major depression (n=7). In this figure, the antidepressant effects of ketamine emerge after the psychotigenic and euphoric effects of ketamine abate. The top figure presents the reduction in Hamilton Depression Scale (HDRS) scores in patients administered ketamine, but not placebo. The middle figure presents the production of euphoria, as measured by a visual analog scale of “high”, following ketamine, but not saline. The bottom figure presents the production of psychosis, as measured by the Brief Psychiatric Rating Scale (BPRS) positive symptom subscale. The repeated measures ANOVA performed on each of these outcomes revealed highly significant ketamine by time interaction effects (p<.005). This figure is adapted from Berman, et al. (32).

