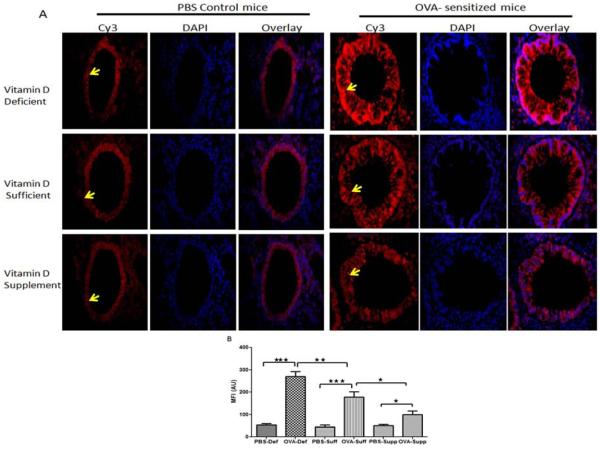
Figure 6.
Protein expression of RelA (arrowhead) in lung tissue: Immunofluorescence showing protein expression of RelA in lung of PBS control vitamin D deficient, vitamin D sufficient and vitamin D supplemental mice compared to OVA sensitized and challenged vitamin D deficient, vitamin D sufficient and vitamin D supplemental mice at 600 × magnification (A). Sections were stained using rabbit anti- NF-κB p65 antibody and goat anti-rabbit as secondary antibody. DAPI was used to stain the nuclei. Seven mice were analyzed per group. (B) Mean fluorescent intensity (MFI) of RelA immunostaining in lung tissue measured in arbitrary units (AU) (using NIH Image J software). Data is shown as mean ± SEM from ten measurements per mouse *p <0.05, **p<0.01, ***p <0.001.

