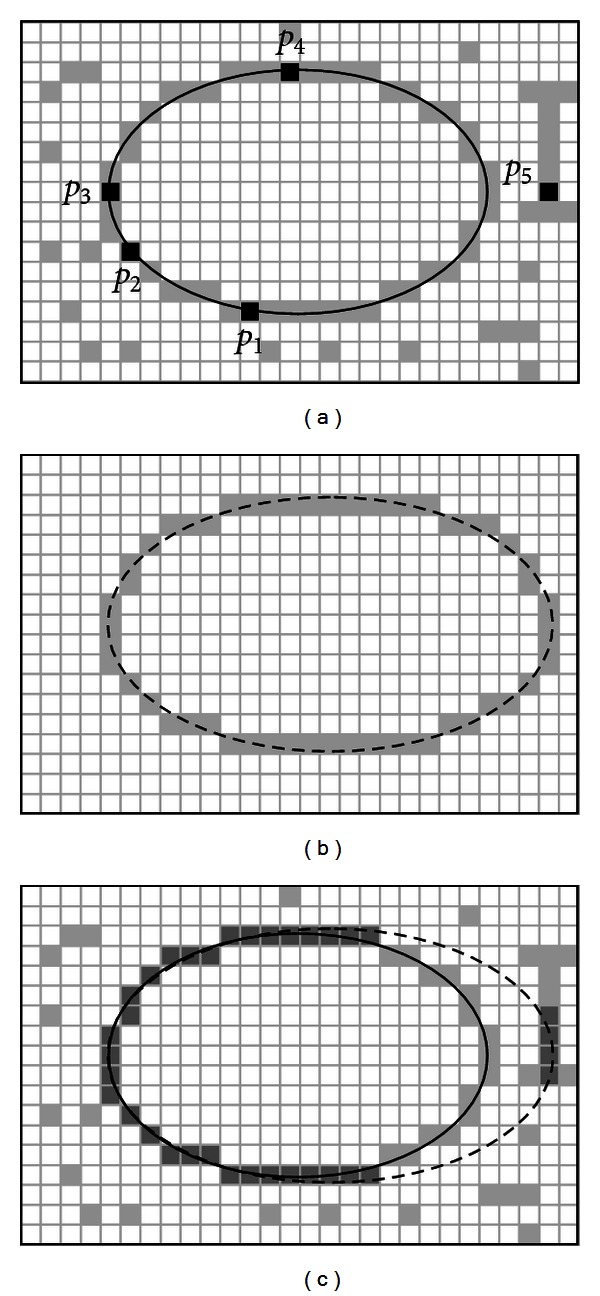
Figure 5.

Evaluation of a candidate solution E: the image in (a) shows the original image while (b) presents the generated virtual shape drawn from points p 1, p 2, p 3, p 4, and p 5. The image in (c) shows coincidences between both images which have been marked by darker pixels while the virtual shape is also depicted through a dashed line.
