
Figure 4.
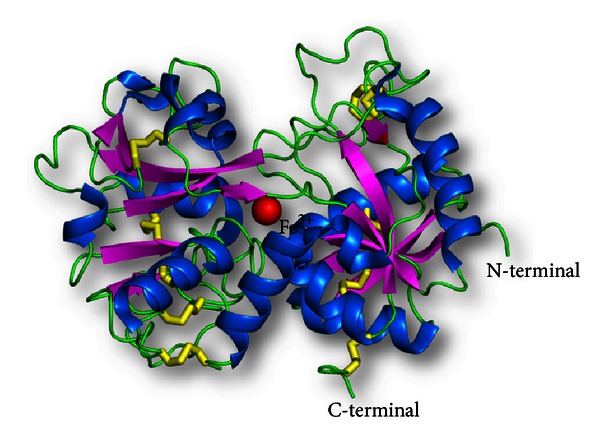
Schematic diagrams of C-lobe of bovine lactoferrin, produced using limited proteolysis with proteinase K (PDB code: 1NKX). α-helices are represented as blue helices, β-sheets are indicated by magenta arrows, and disulfide bonds are indicated as yellow sticks. The iron atom is shown in red.