
Figure 6.
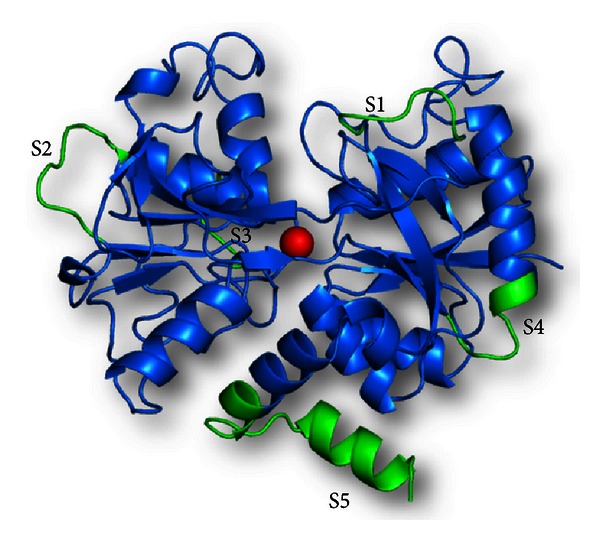
Schematic diagrams of C-lobe of bovine lactoferrin (in blue), showing the sequences which are most variable across species in green. The sequences have been labeled S1–S5.
Official websites use .gov
A
.gov website belongs to an official
government organization in the United States.
Secure .gov websites use HTTPS
A lock (
) or https:// means you've safely
connected to the .gov website. Share sensitive
information only on official, secure websites.
Schematic diagrams of C-lobe of bovine lactoferrin (in blue), showing the sequences which are most variable across species in green. The sequences have been labeled S1–S5.