
Figure 2.
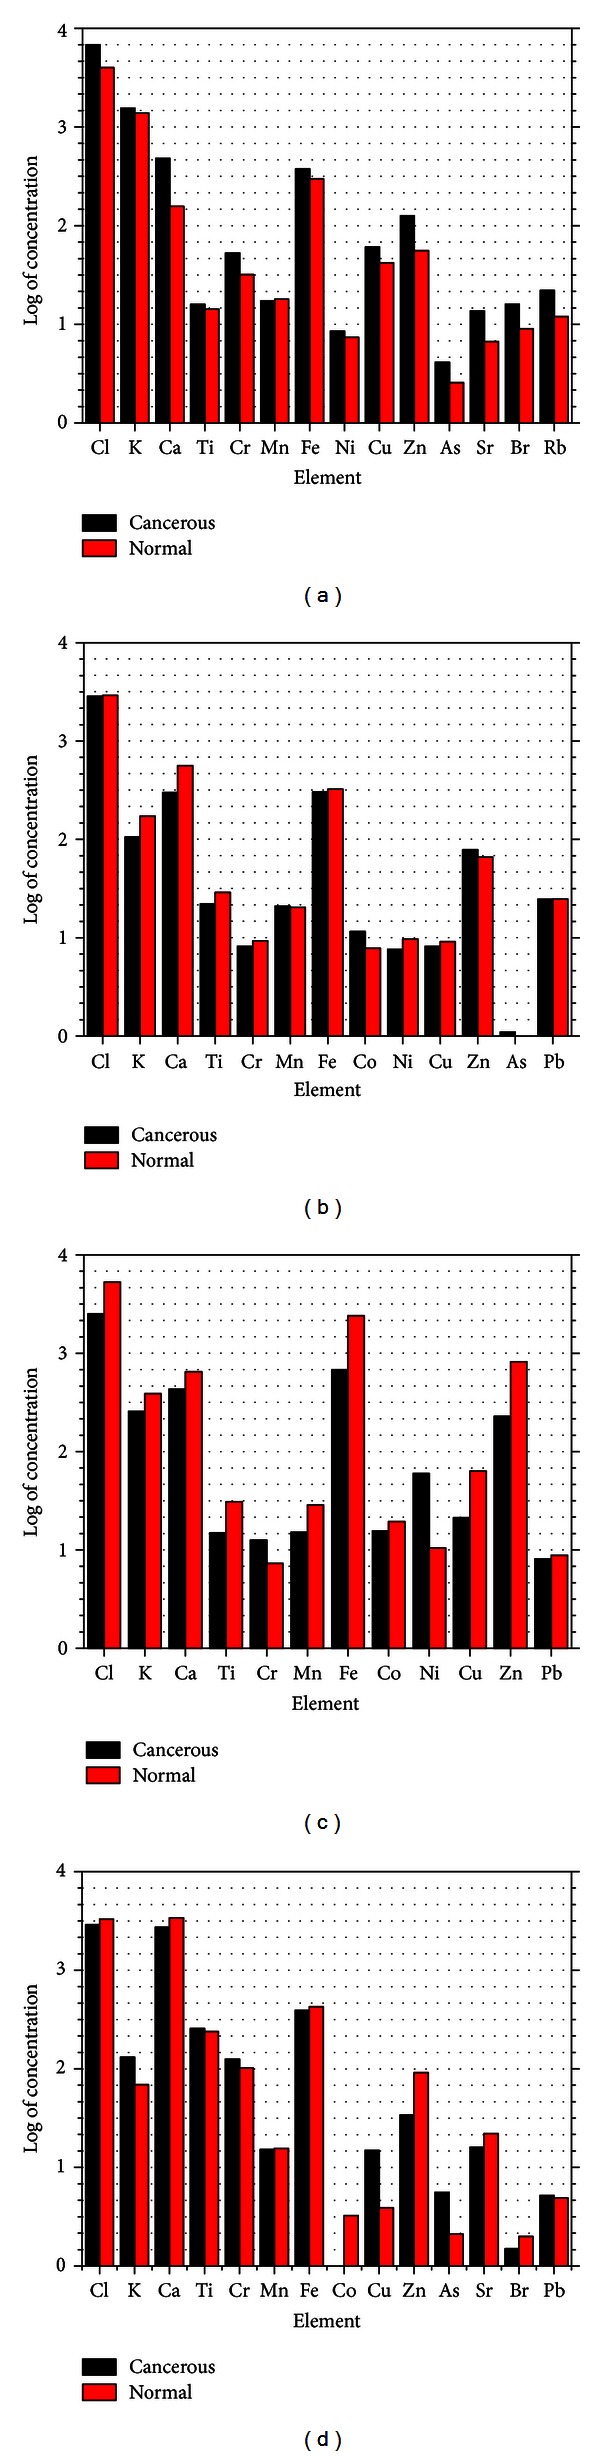
(a), (b), (c), and (d) show the bar charts of the log of concentrations of the trace elements for the breast, kidney, stomach, and testis tissues, respectively, which shows the correlation of the trace metal concentration of the cancerous and normal tissues of the selected organs.