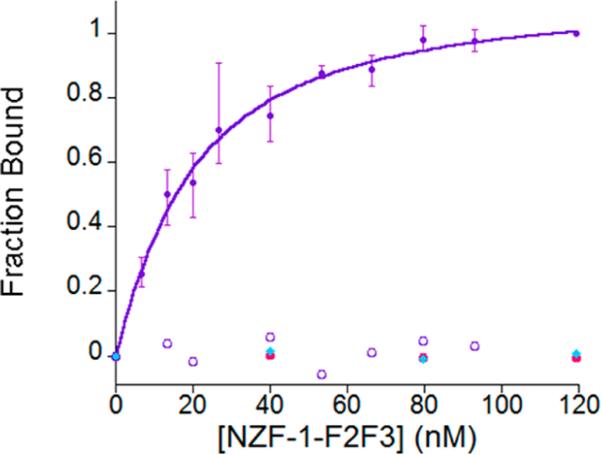
Figure 4.
Comparison of the change in anisotropy (as fraction bound) as NZF-1-F2F3, shown in closed purple circles, CCFHC, shown in closed pink circles, and CCHFC, shown in closed blue diamonds, are titrated in 10 nM fluorescently labeled β-RAR DNA. An example of a control titration (NZF-1-F2F3 with a randomized segment of DNA) is shown in open purple circles. All experiments were performed in triplicate in 50 mM HEPES, 100 mM NaCl pH 7.5.

