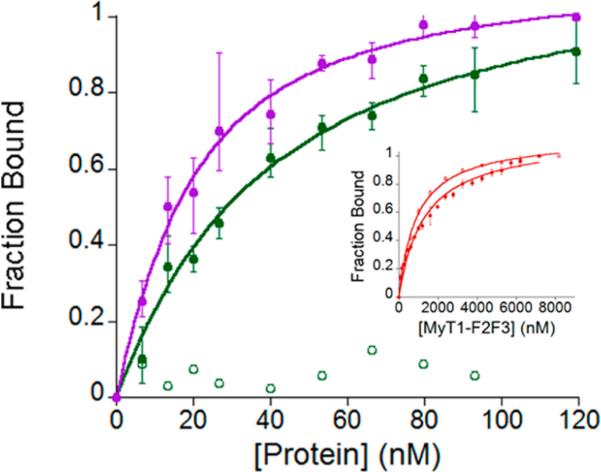
Figure 7.
Change in anisotropy (as fraction bound) as NZF-1-F2F3, shown in closed purple circles, and Q291R MyT1-F2F3, shown in closed green circles, are titrated into β-RAR DNA. Example of the control as Q291R MyT1-F2F3 is titrated into a random segment of DNA is shown in open green circles. Inset shows change in anisotropy as MyT1-F2F3 is titrated in β-RAR (closed red circles) and random DNA segment (open red circles). Ten nM fluorescently labeled DNA used for all experiments. All experiments were performed in triplicate in 50 mM HEPES, 100 mM NaCl pH 7.5.

