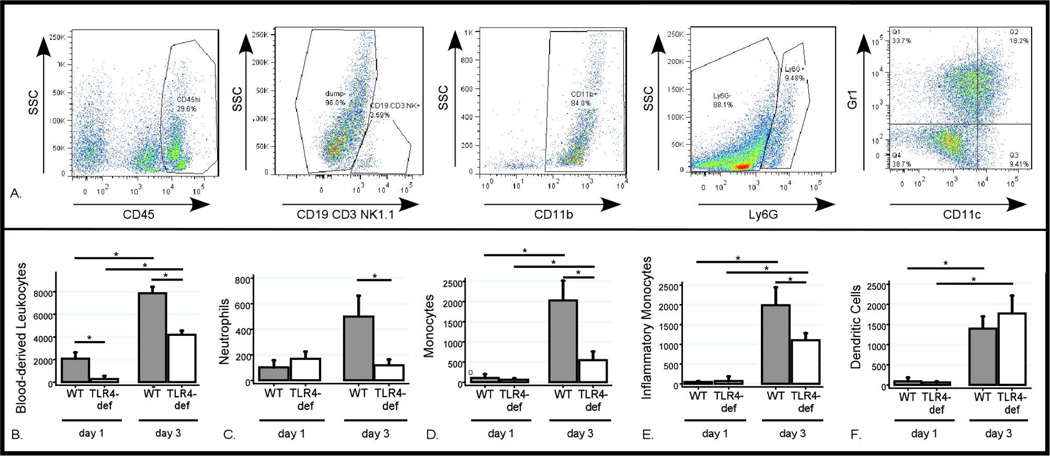
Figure 2. Flow cytometric analysis of inflammatory infiltrate following ICH.
Brain flow cytometry results after ICH surgery. (A) Gating strategy of live cells to identify all blood-derived leukocytes (CD45hi), neutrophils (CD45hiCD3−CD19−NK1.1−CD11b+Ly6G+), monocytes (CD45hiCD3−CD19−NK1.1−CD11b+Ly6G−CD11c−GR1−), inflammatory monocytes (CD45hiCD3−CD19−NK1.1−CD11b+Ly6G−CD11c−GR1+) and dendritic cells (CD45hiCD3−CD19−NK1.1−CD11b+Ly6G−CD11c+). (B–F) Differences in each cell population between days 1 and 3 post-ICH in WT and TLR4-deficient mice. Data expressed as mean ± SEM excess ipsilateral cells, *= p<0.05 with correction for multiple comparisons, n=4 / genotype on day 1 post-ICH and n=6 /genotype on day 3 post-ICH.

