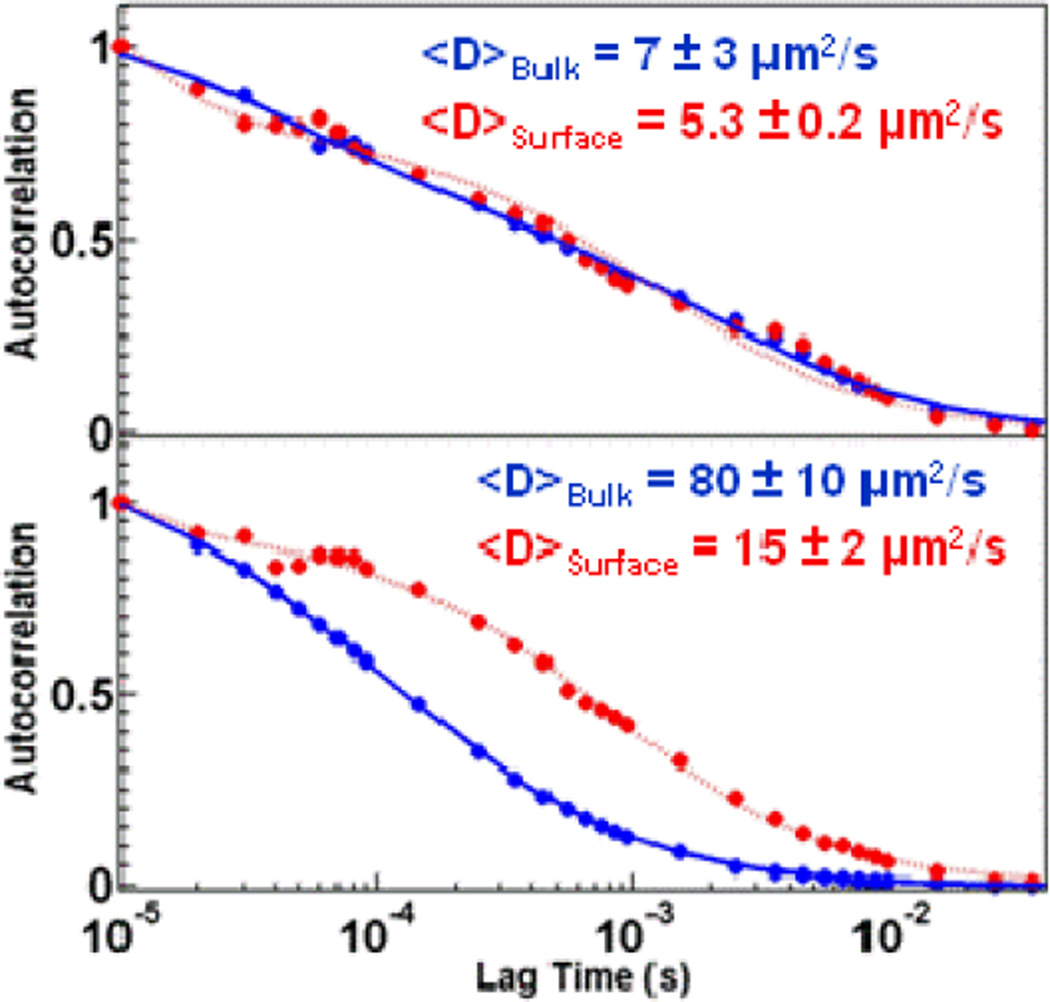
Figure 7.
Autocorrelation curves for α-lactalbumin at different locations on a peptide functionalized agarose surface measured in the bulk (blue) and at 0.5 µm from the surface (red). Measurements at certain locations on the same sample indicate only nonspecific interactions dominate transport phenomena (top panel). Measurements at other locations indicate strong interactions between the protein and the peptide-functionalized agarose surface (bottom panel).

