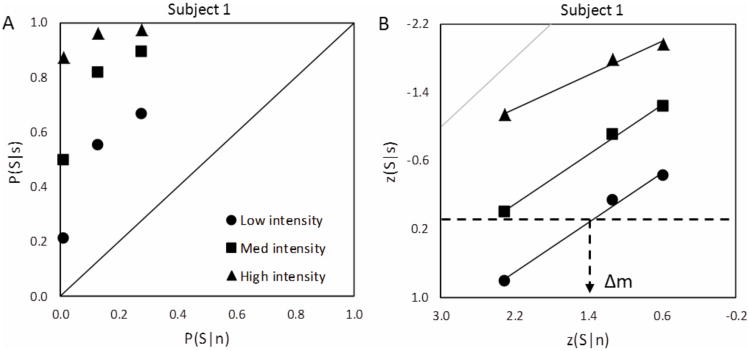
Figure 1.
Receiver Operating Characteristic (ROC) analysis and determination of discriminability, Δm. A) Typical ROC curves for Subject 1, from rating-only data. B) ROC curves for the same subject on a double probability plot and with a sample estimation of discriminability from linear fits to the low intensity curve −Δm equals z(S|n) on the ROC curve where z(S|s) equals zero (dashed lines). p(S|s) and p(S|n) are the correct detection and false positive rates, and z(S|s) and z(S|n) are their inverse normal distribution transformations. Here slopes fitting ROC data on double probability plots are less than one, as is expected with Poisson rather than Gaussian distributions. Gray line is a slope of one for comparison.

