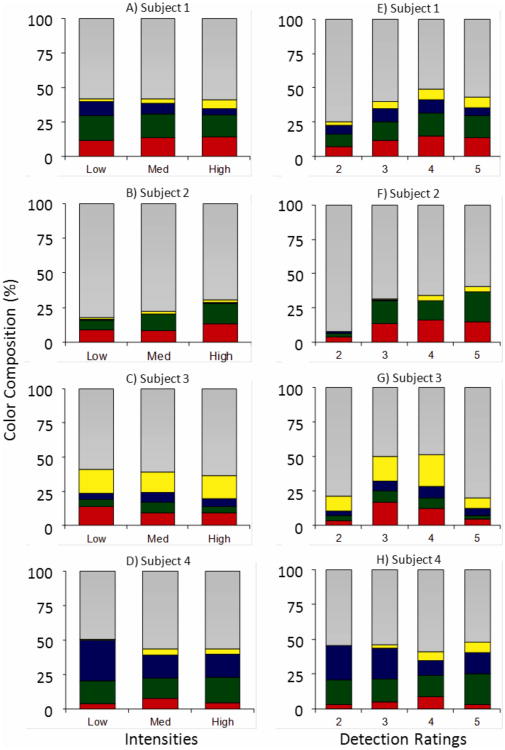
Figure 8.
Red, green, yellow, blue and white responses (corresponding color segments, except gray segments incorporate white, gray, or uncertain hue responses) as a proportion of total hue response for each nonzero stimulus intensity (Subjects 1-4, A-D), and each subjective detection criterion (Subjects 1-4, E-H). For subjects 1, 2 and 4 the proportion of yellow (blue) tends to increase (decrease) with increasing intensity, a trend toward veridical hue for a 580 nm stimulus.

