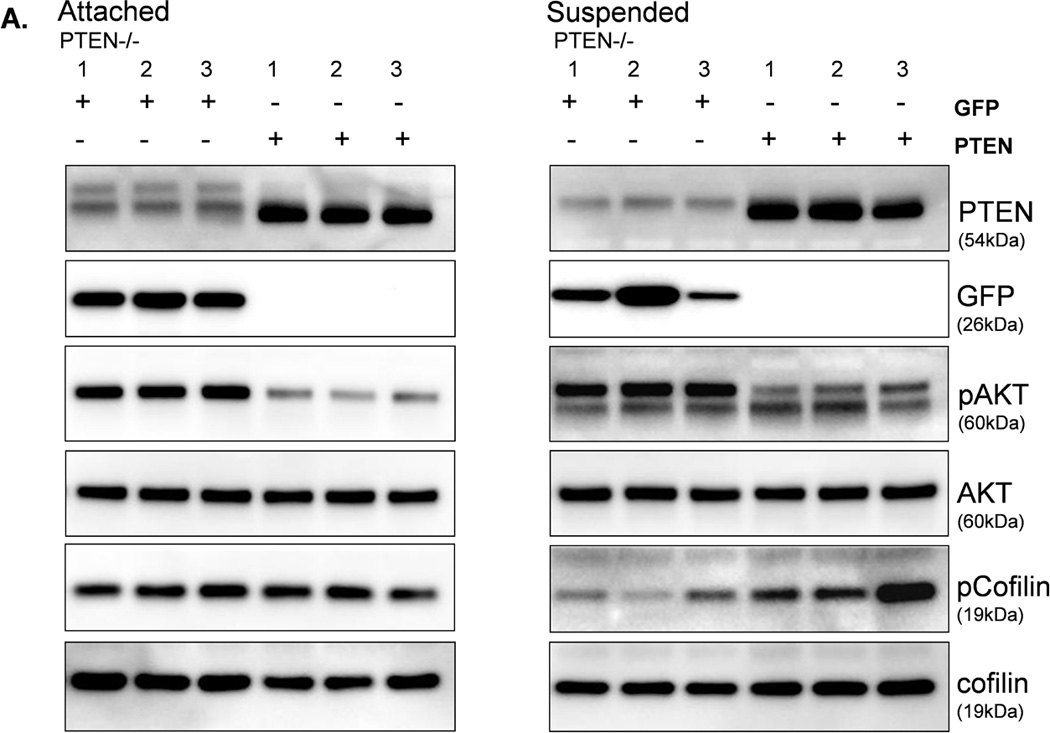
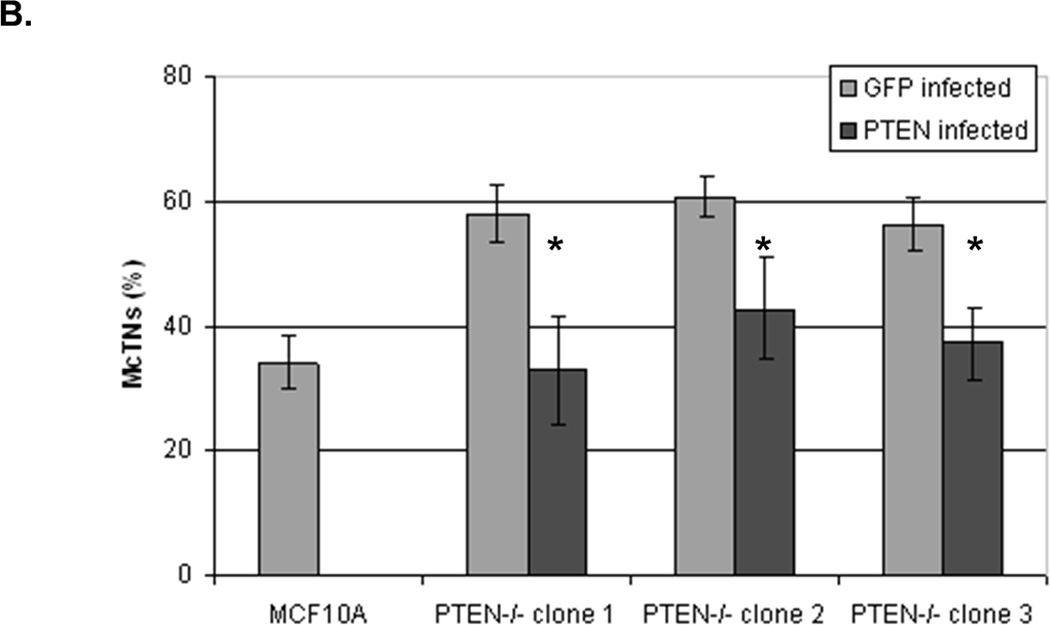
Figure 7. Expression of PTEN decreases activated cofilin and McTNs in PTEN−/− cells.


MCF-10A PTEN−/− clones (1, 2, and 3) were infected with either PTEN or GFP (CT) adenovirus once a day for two days. A. Both attached and suspended (1h) cells were analyzed by Western blot for pCofilin (n=3, representative blot) and B. McTNs formation (n=6, *p<0.002).
