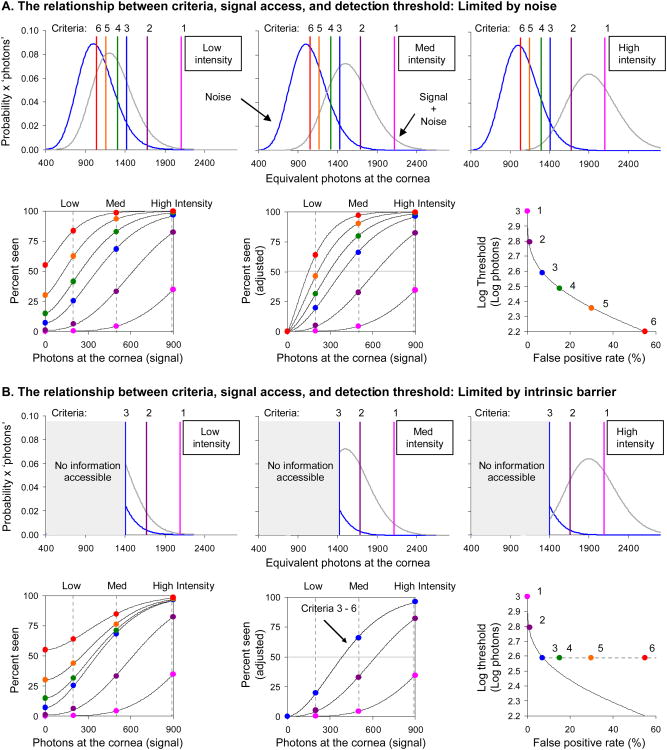
Figure 1.
Signal detection theory (SDT; Green & Swets, 1966) predicts that in distinguishing a signal (grey distribution) from noise (blue distribution) observers can increase sensitivity and lower detection thresholds by using more lenient response criteria (represented by colored vertical lines and points, ranging from pink to red, and numbered 1 (strictest) – 6 (most lenient)). A) Low, medium, and high intensity stimuli (left, center and right; row 1, also indicated by the dashed vertical grey lines in row 2) are detected against irreducible noise. Detection thresholds are interpolated at 50% seen (at the intersection of the solid grey line and the frequency of seeing curves, row 2, center) after adjusting for the non-zero false positive rate as in Equation 1. Detection thresholds are still seen to decrease after this adjustment (row 2, right) indicating a net gain in performance with more lenient criteria. Row 2 right shows the expected Poisson noise-limited reduction in detection threshold (solid curve). B) An intrinsic barrier limits access to signal information (grey boxes, row 1). Subjects cannot reduce the detection criterion below this point. They can continue to increase the false positive rate by guessing, but the rate of seeing and of false positives increase in step and there is no further improvement in threshold (row 2). Row 2, right shows limited threshold reduction (plateau, dashed line) in the face of an intrinsic barrier to information access. All distributions shown are Poisson probability density functions.

