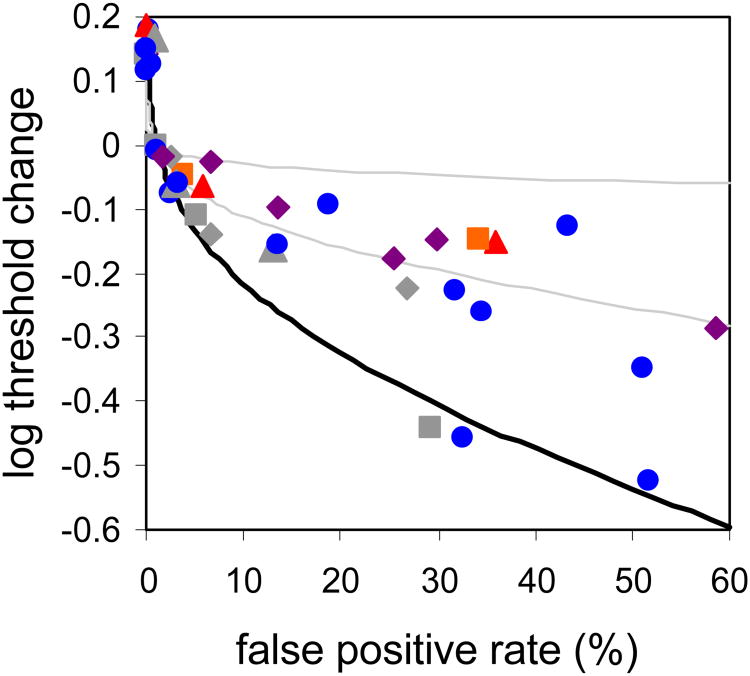
Figure 4.
Rod thresholds for our four subjects (Subjects 1 (blue circles), 2 (red triangles), 4 (purple diamonds) and 6 (orange squares)) and Sakitt's three subjects BS, LF and KD (grey squares, diamonds and triangles; Sakitt 1972). As in Figure 3, to better compare across subjects, curves were shifted vertically with the aid of a detection model (described in detail in the Discussion) so that the 1% false positive point, which loosely reflects a typical ‘yes-no’ threshold, coincides with a log threshold change of zero. Thresholds are significantly more responsive to reductions in response criteria for rods than for cones; range for cone data shown as light gray lines).

