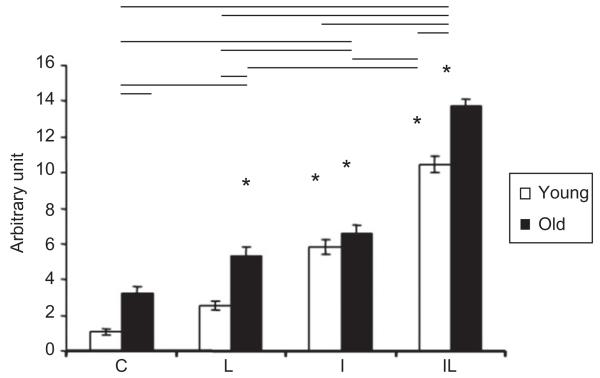
Figure 6.
Levels of MyoD mRNA in the TA muscle of rats, where *: p<0.05 corresponds intragroup comparisons, i.e., the significant differences between groups IL, I, and absolute control (C) of young specimens; and between groups IL, I, and L in the elderly group with absolute control (C) of the elderly specimens. The horizontal bars in the upper part of the figure indicate the intergroup comparisons showing statistical differences, between young and elderly groups.

