Figure 5.

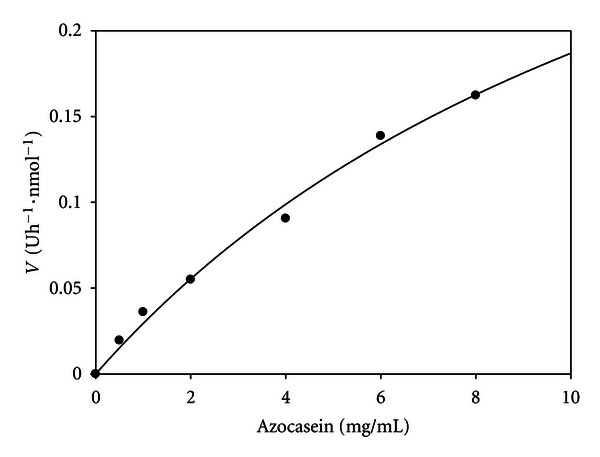
Michaelis-Menten plot of normalized velocity versus azocasein concentration. Each point represents the mean of two determinations. Statistic parameters: r 2 = 0.9931; N = 7; P < 0.0001.

Michaelis-Menten plot of normalized velocity versus azocasein concentration. Each point represents the mean of two determinations. Statistic parameters: r 2 = 0.9931; N = 7; P < 0.0001.