
Fig. 3.
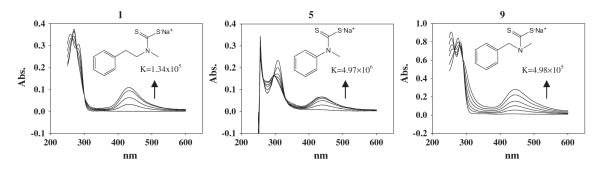
Copper complex formation and the binding of compound with copper. The UV spectra of complexes formed between PDTC analogues 1, 5 and 9 and copper and their binding constants. The concentration of PDTC analogue was 100 μM. The absorption band of the complex at 430 nm increases as Cu concentrations were 10, 20, 30, 40, 50 and 60 μM.