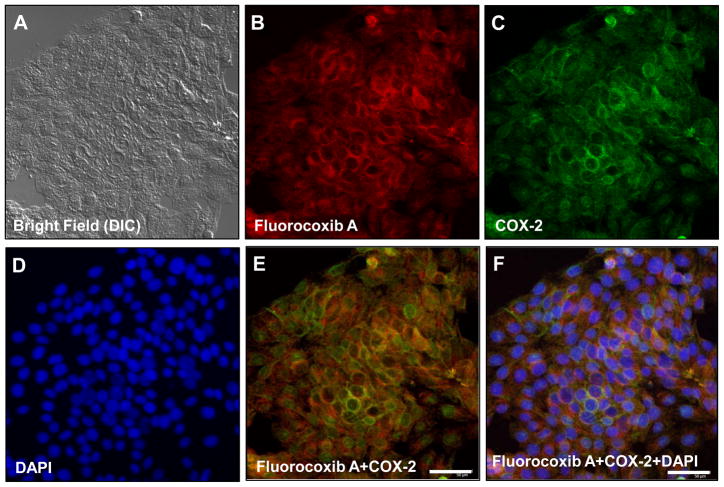
Figure 3. Fluorocoxib A uptake by COX-2-expressing K9TCC#1Lilie cells in vitro.
(A) DIC image of primary K9TCC#1Lillie cells. (B) Specific uptake of fluorocoxib A (1 μM; 1 h) by K9TCC#1Lillie (red color) (C) with COX-2 expression detected by Alexa Fluor488nm (green color) (D) and counterstained with DAPI for nuclei detection (blue color). (E) Merged (B and C) images to confirm overlap of fluorocoxib A uptake with COX-2 expression. (F) Merged (B, C and D) images.

