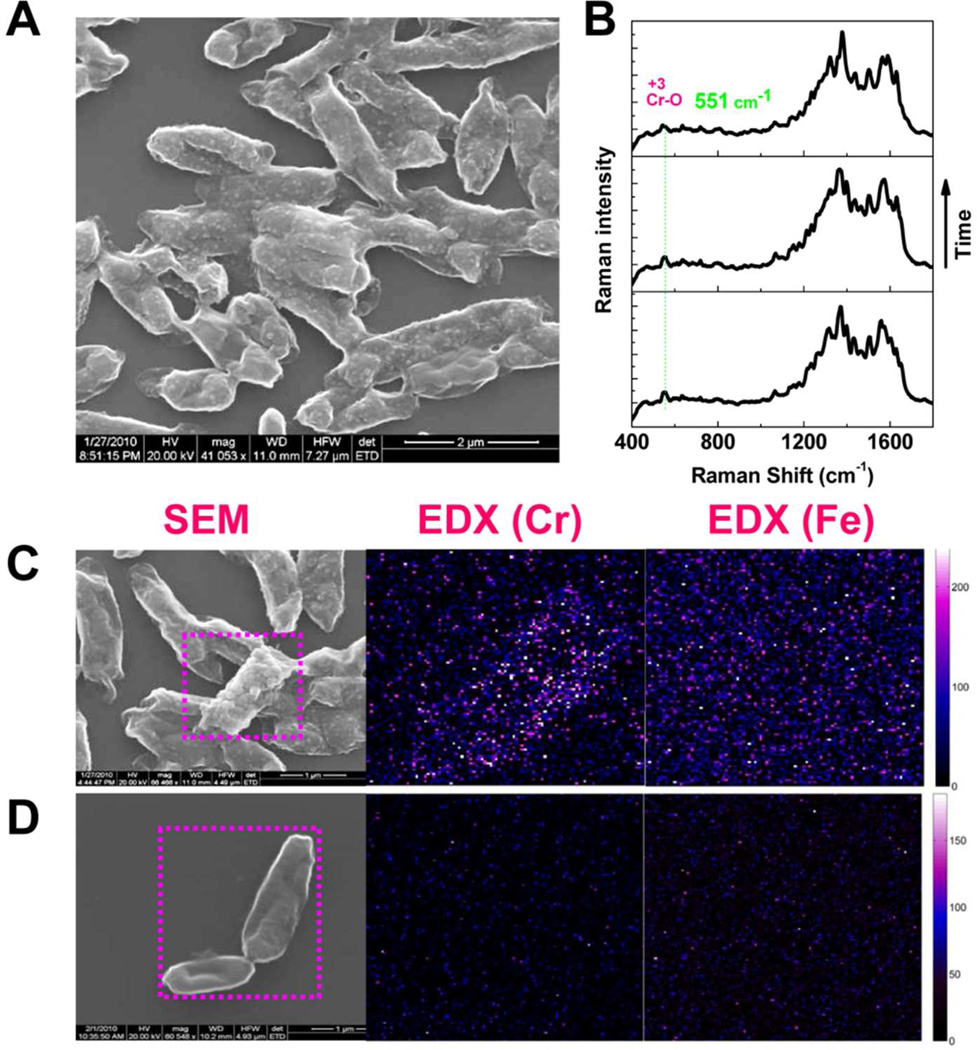
Figure 3.
Imaging and spectroscopic characterization of the Cr(VI) reduction with hematite involved. (A) SEM image of the wild type MR-1 after hematite-involved Cr(VI) reduction. The appearance of the nanoparticles is obvious on the cell surface. (B) Using SERS, specific vibrational mode signature signal of Cr(III)-O of Cr2O3 is recorded and used to identify the Cr(III) product redox state. (C) Using EDX, Cr is observed to be concentrated on the cell surface but no Fe is observed for the wild type MR-1. (D) For the double ΔomcA-ΔmtrC as a reducer, cell surface is smooth with less possibility of finding the nanoparticles. There is no concentrated Cr or Fe that can be observed using EDX.

