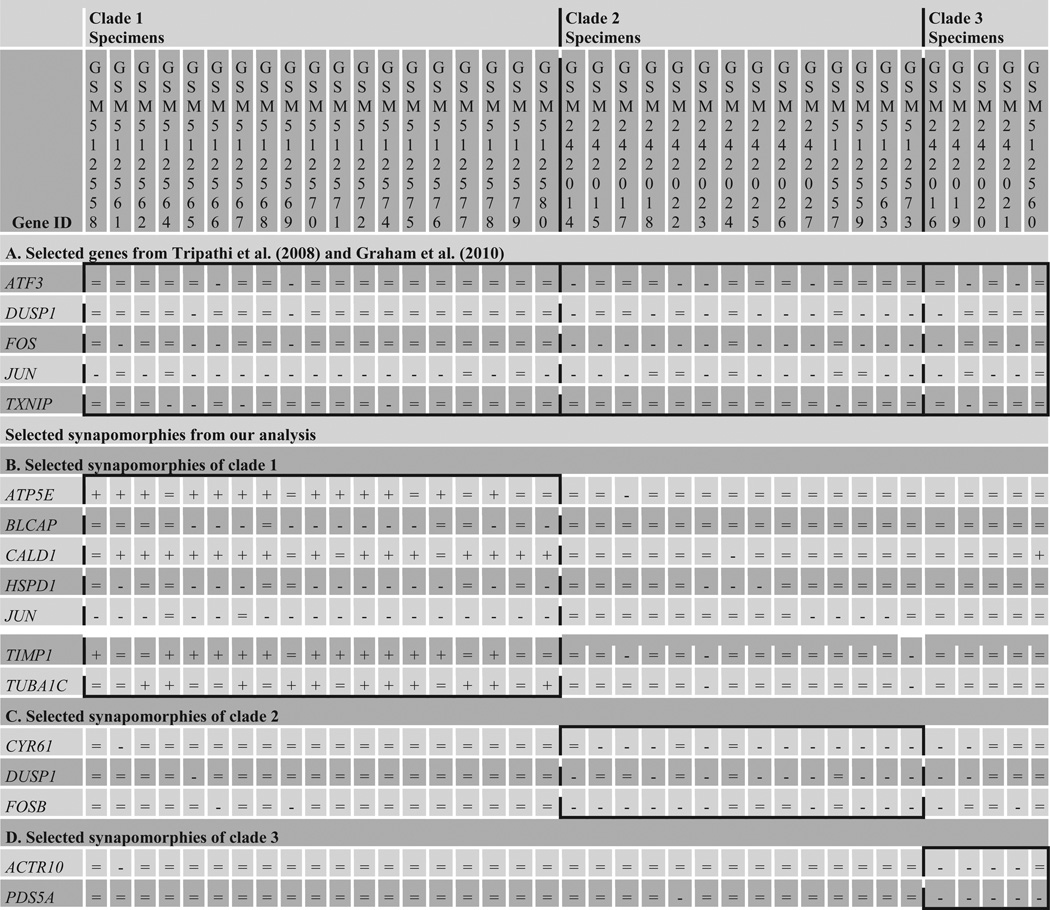
Fig. 2.
Gene-expression heterogeneity in HNTDI. Selected genes from differentially-expressed gene list of Tripathi et al. [2008] and Graham et al. [2010] were not uniformly expressed in all of the HNTDI specimens, while the parsimoniously identified synapomorphies for the 3 clades of HNTDI were more specific to each clade with lesser exceptions than in gene lists of Tripathi et al. [2008] and Graham et al. [2010]. =: No change; −: underexpressed; +: overexpressed.

