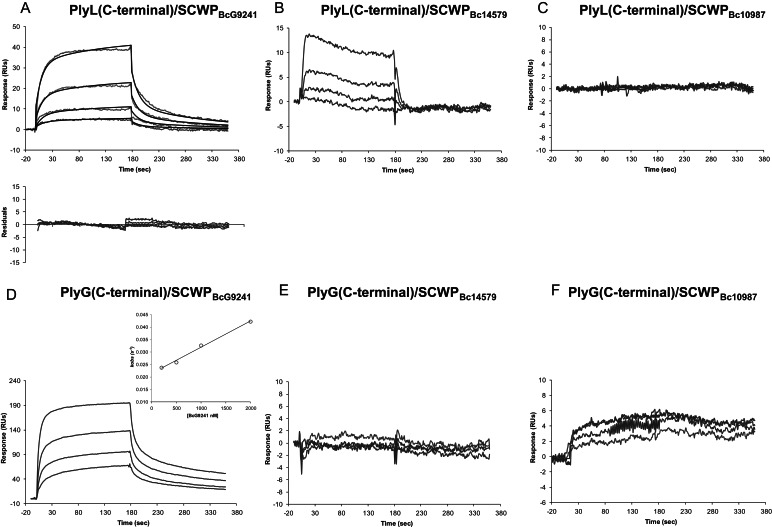
Fig. 7.
BIAcore analysis of the interaction between the C-terminal domain of endolysins PlyL (top panel) and PlyG (bottom panel) and SCWPs isolated from strains B. cereus G9241 (A and D), B. cereus ATCC14579 (B and E) or B. cereus ATCC10987 (C and F). Concentrations of SCWPs used were same as described in Figure 6 (as described there, the baseline response is also subtracted from the response curves and not shown) and experimental conditions as described in the Figure 3 legend.

