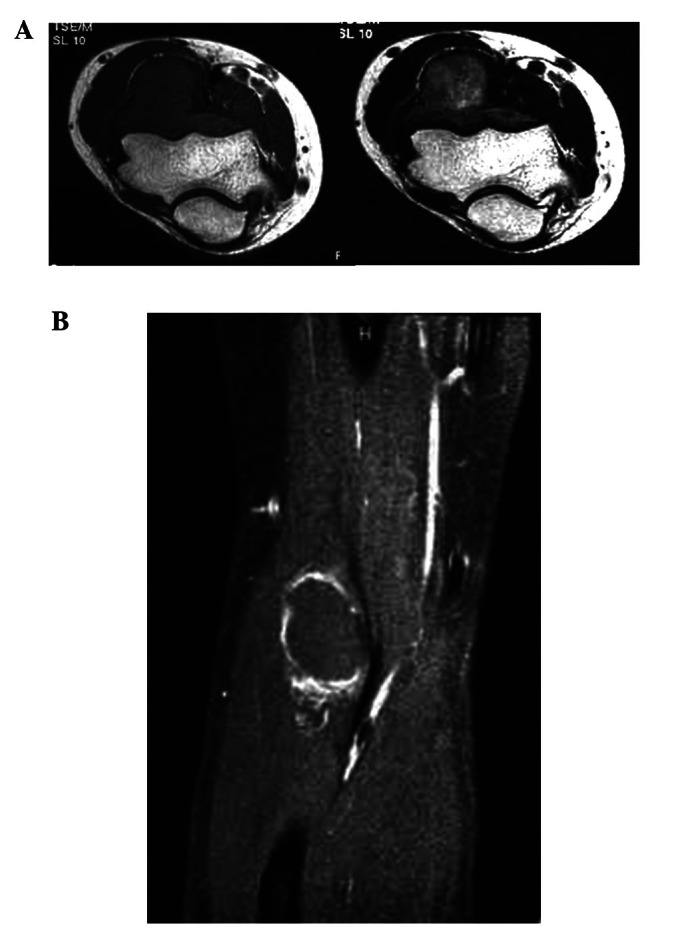
Figure 2.

(A) Magnetic resonance image showing the tumor located between the brachioradialis and brachialis. The signal intensity of the tumor was isointense to muscle on T1-weighted images (left) and hyper- or isointense to muscle on T2-weighted images (right). (B) On gadolinium-enhanced magnetic resonance images, the margin of the tumor was well-contrasted.
