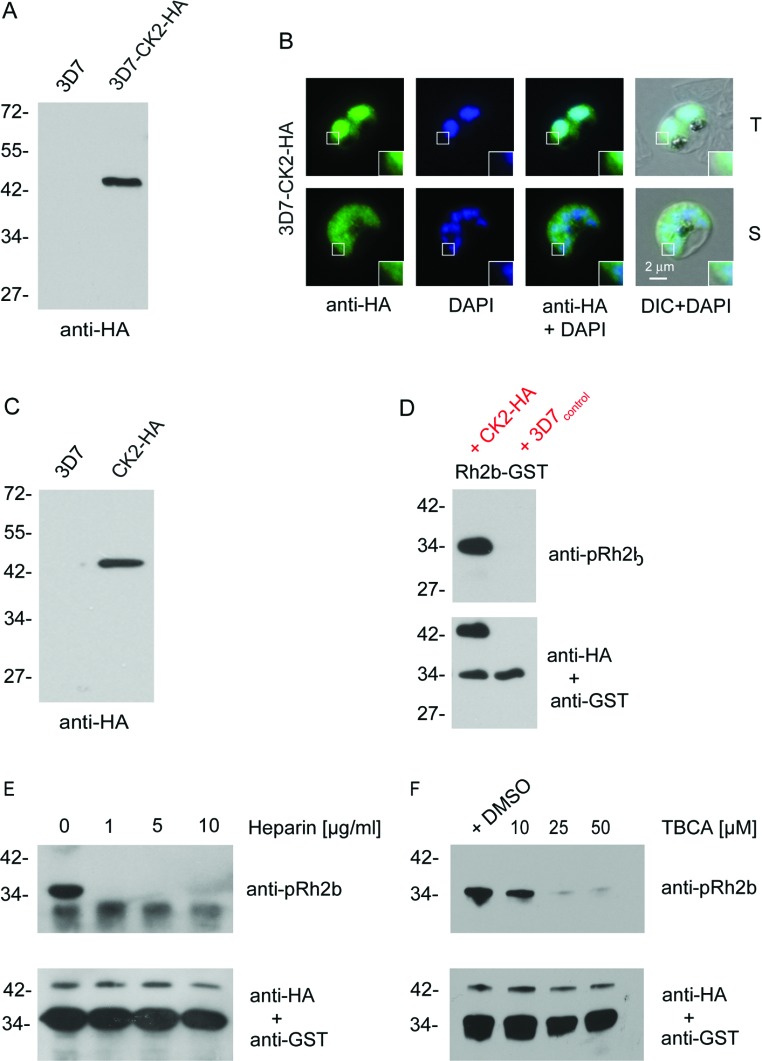
Figure 4. Expression, purification of PfCK2 α and Rh2b in vitro phosphorylation.
(A) Western blot analysis of transgenic CK2–HA parasites that express an endogenous (3D7–CK2–HA) fusion protein. Expression of the fusion proteins was confirmed using an anti-HA antibody. The parental 3D7 strain (3D7) was used as a control. (B) Immunofluorescence microscopy using endogenously derived PfCK2α–HA. Localization with the anti-HA antibodies (green) confirmed expression in the nucleus (blue, DAPI) and cytosol of fixed parasites in the trophozoite (T) and schizont (S) stage. Scale bar indicates 2 μm. Enlargements of selected areas are marked with a white square. DIC, differential interference contrast microscopy. (C) Western blot analysis of transgenic CK2–HA parasites that overexpress CK2–HA. Expression of the fusion proteins was confirmed using an anti-HA antibody. This cell line was used to immunopurify CK2–HA for subsequent phosphorylation assays. (D) Western blot analysis of phosphorylated Rh2b CPD using immunoprecipitated CK2–HA. Phosphorylation was detected using the phospho-specific anti-pRh2b antibody. CK2 was visualized with an anti-HA antibody and an anti-GST antibody was used as the loading control. (E) Western blot analysis of CK2-dependent phosphorylation of Rh2b in the presence of different heparin concentrations. CK2 was visualized with an anti-HA antibody and an anti-GST antibody was used as the loading control. (F) Western blot analysis of CK2-dependent phosphorylation of Rh2b CPD in the presence of different TBCA concentrations. CK2 was visualized with an anti-HA antibody and an anti-GST antibody was used as the loading control. The molecular mass is shown in kDa on the left-hand side of the blots.

