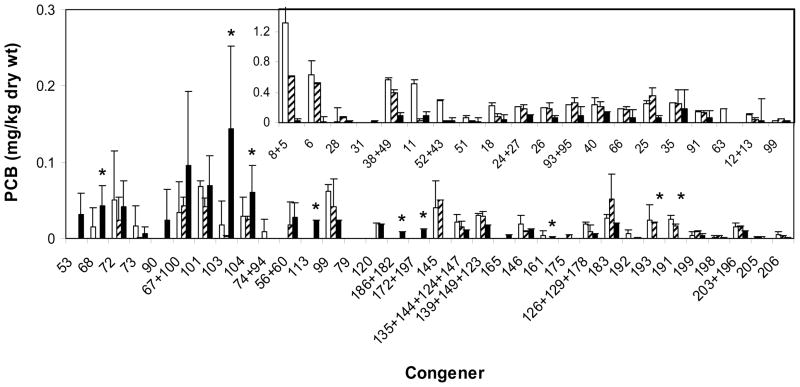
Figure 3.
Profile showing the most significant changeS in PCB congener distribution between at day 0 (□) and day 365 in the untreated mesocosm (
 ) and the mesocosm bioaugmented with LB400 plus DF1 (■). Inset; congeners inferred to be degraded by LB400 (no products). An asterisk (*) indicates potential substrates or products of DF1 dechlorination that are significantly different between mesocosm amended with LB400 and LB400 plus DF1 (P < 0.05). Error bars are calculated from replicate sediment subsamples.

