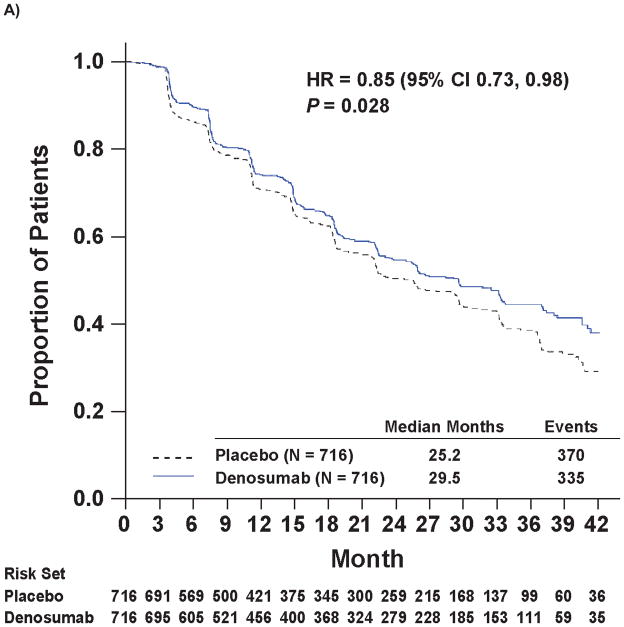
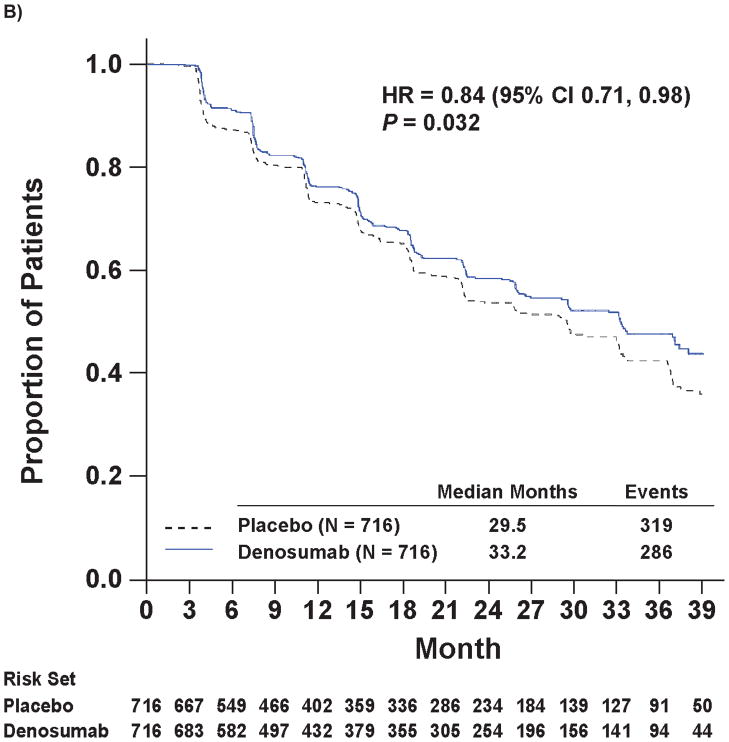
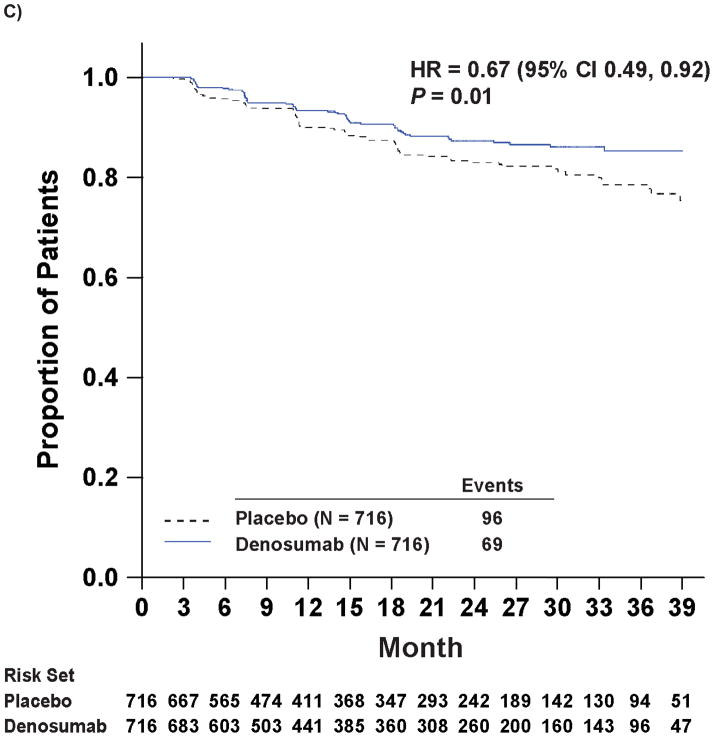
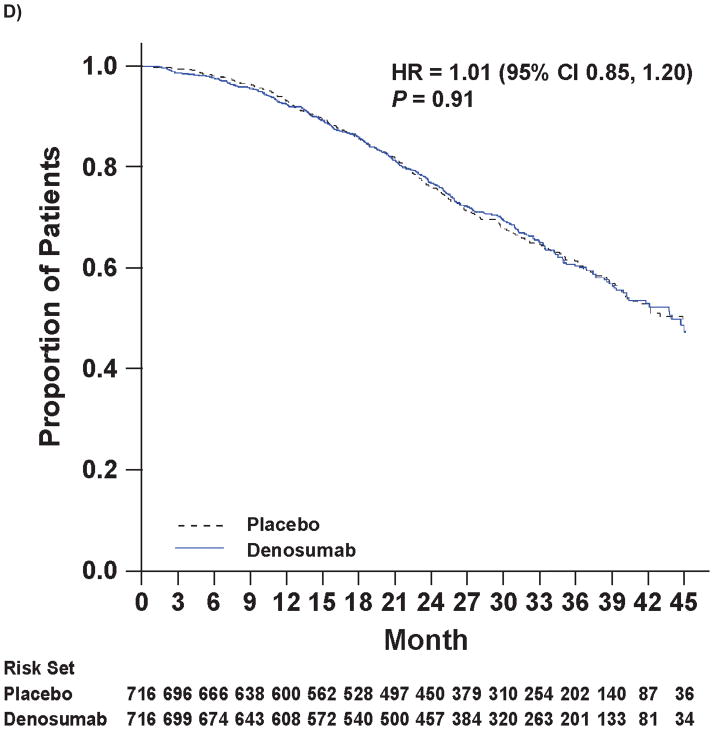
Figure 2.
Kaplan-Meier Curves of Key Efficacy Endpoints
Panel A shows the primary endpoint of bone metastasis-free survival. Panels B and C show the time to bone metastases (asymptomatic or symptomatic) and time to symptomatic bone metastasis, respectively. Panel D shows overall survival.
Note: All curves were truncated when the combined risk sets dropped to below 3.5% of the total risk set (i.e., when there were 50 patients or less in the combined risk sets).


