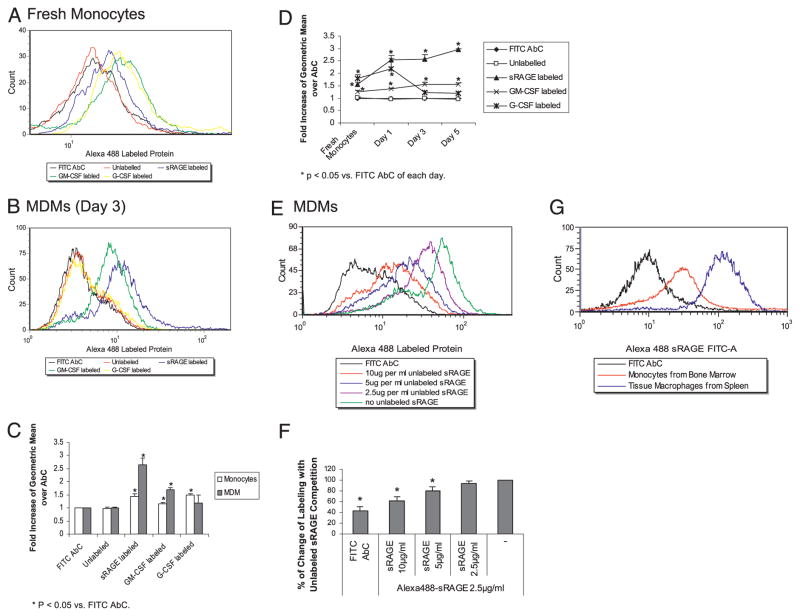
FIGURE 7.
sRAGE binds directly to the cell surface of monocytes and macrophages. Monocytes (5 × 10⁶ cells/ml) (A) or MDMs (B) were incubated with human IgG for 15 min and then incubated with 2.5 μg/ml Alexa Fluor 488-labeled sRAGE protein on ice for 1 h, washed with flow wash buffer, and fixed in 1% paraformaldehyde solution before flow cytometry analysis. C, The flow cytometry data from A and B are expressed as fold increase of geometric mean ± SEM compared with FITC AbC from four independent donors: *p < 0.05 compared with AbC of each day. D, Comparison of flow cytometry data over time was performed. The data are expressed as the fold increase of geometric mean ± SEM compared with Alexa Fluor 488 AbC from four independent donors: *p < 0.05 compared with AbC of each day. E, MDMs were incubated with different concentrations of unlabeled sRAGE on ice for 1 h prior to the incubation with 2.5 μg/ml labeled sRAGE. The cells were analyzed by flow cytometry. F, The flow cytometry data from E are expressed as percent change of labeling compared with cells without competition. Mean fluorescence intensity of cells incubated without unlabeled sRAGE was used as 100% labeling. The data are expressed as the percent change of geometric mean ± SEM from three independent donors: *p < 0.05 versus Alexa Fluor 488-sRAGE. G, Monocytes or macrophages were isolated from mouse bone marrow and spleen, respectively. The cells were incubated with mouse IgG for 15 min and then incubated with 2.5 μg/ml Alexa Fluor 488-labeled sRAGE protein on ice for 1 h and fixed in 1% paraformaldehyde solution before flow cytometry analysis. Shown is a representative histogram from two independent mice.

