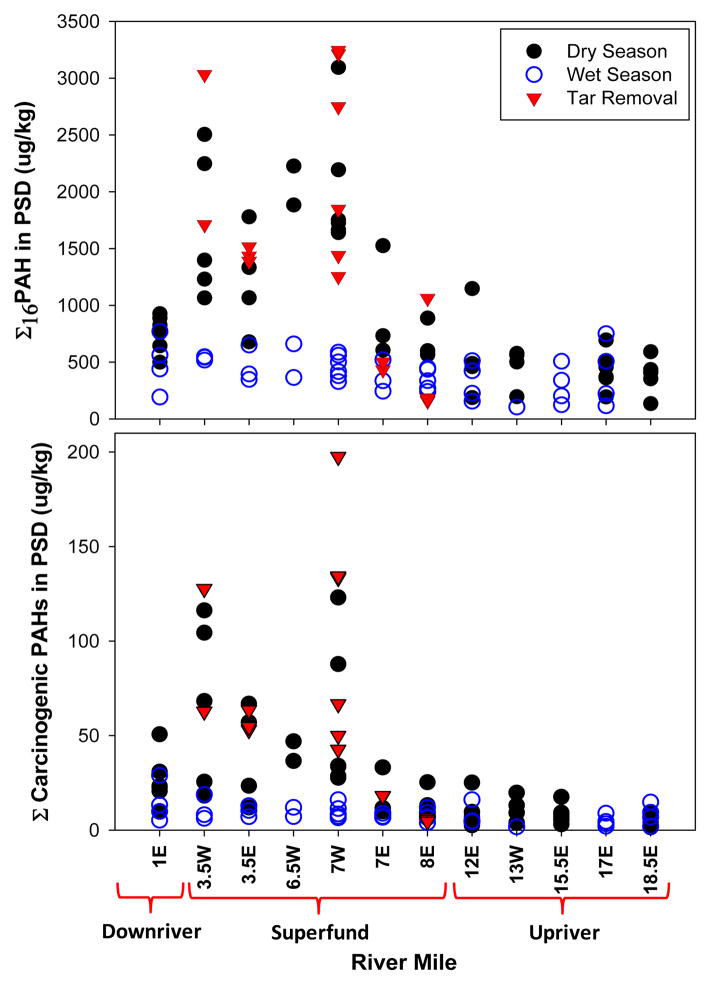
Figure 2.
Σ16PAH and carcinogenic PAHs in PSDs. Mass-to-mass concentration of sum PAHs and sum carcinogenic PAHs in passive sampling devices (PSDs) at sites downriver, upriver and within the Portland Harbor Superfund megasite. Each point represents one observation during the dry season (closed circles), wet season (open circles) or tar removal remediation (triangles). These values were used in place of fish tissue concentrations to calculate exposure for risk assessment models.

