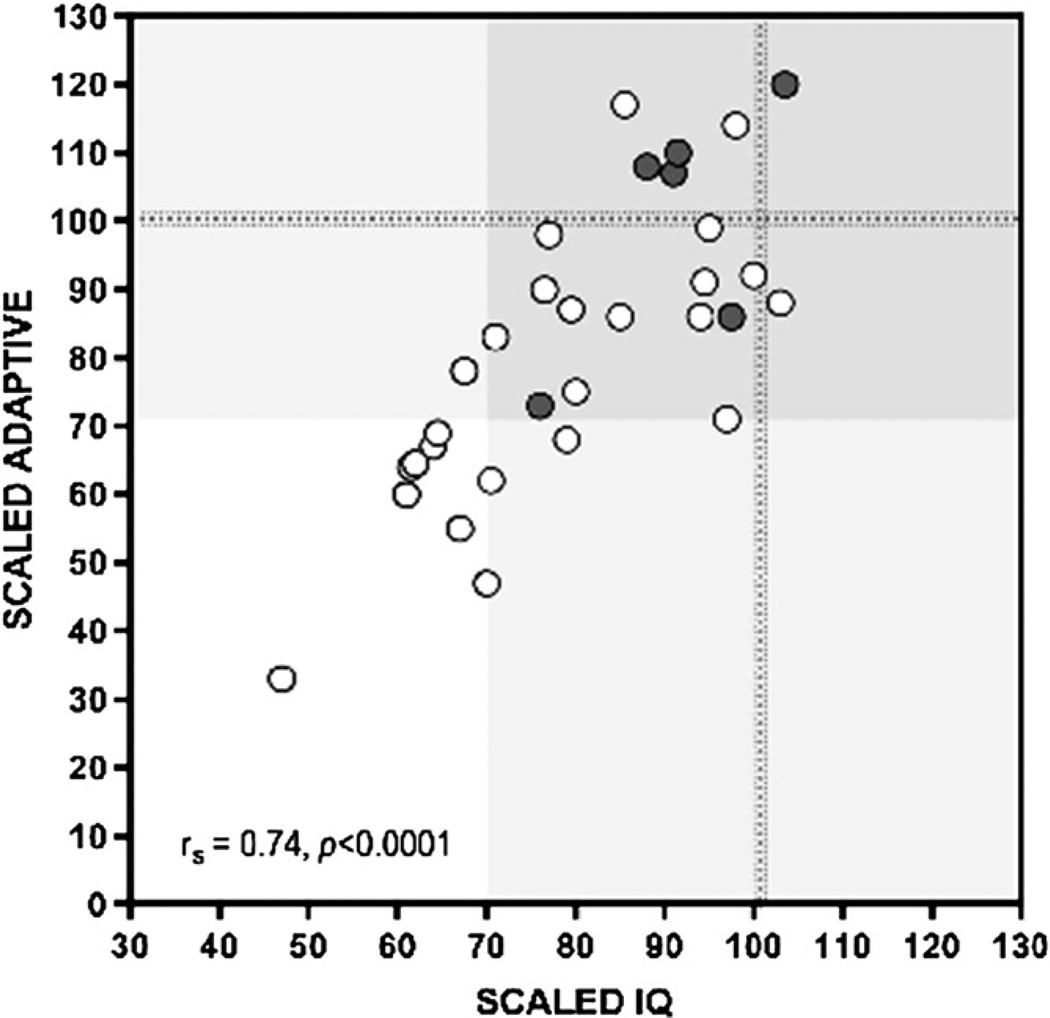
Figure 2.
In 33 pretransplantation patients, there was a strong correlation between IQ (x-axis) and adaptive function (y-axis). Only 3 patients had IQ scores at or above the mean (100; dotted line). One-third had IQ scores in the deficient range (≤70). Shaded areas represent the mean ±2 SD in normal subjects. Gray circles represent Old Order Mennonite subjects and indicate that different cultural background did not bias toward lower test scores. Open circles indicate non-Old Order Mennonite patients.

