
Fig. 5.
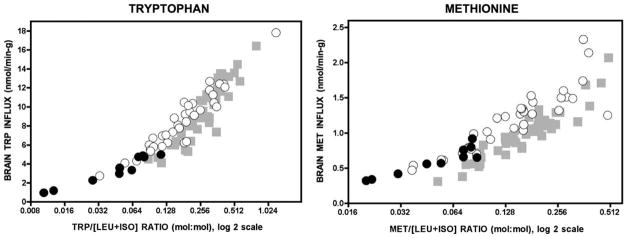
The panels depict how the concentration ratio of an LAT1 substrate (e.g., tryptophan or methionine) to the sum of leucine and isoleucine (x-axis) relates to its calculated uptake across the blood–brain barrier (y-axis). Before the formula trial, low concentration ratios were associated with low brain uptake (black circles). Treatment with study formula (white circles) reduced leucine and isoleucine levels while simultaneously increasing plasma concentrations of other LAT1 substrates (See Table 5). Incrased competitor: [leucine + isoleucine] ratios increased calculated brain uptakes to the control range (gray squares; N = 52). Note the x-axis is a log 2 scale.