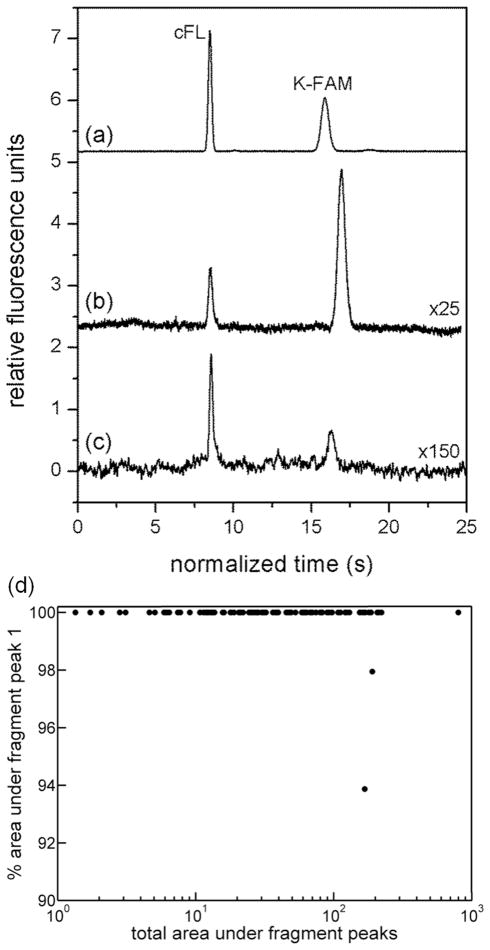
Figure 2.
Electropherograms of peptide fragments from untreated samples, including (a) ensemble lysate formed from 107 cells and (b) single cells loaded with the internal standard (carboxyfluorescein, cFL) and the reporter peptide. Peaks in (a) were identified by addition of standards to the sample. (c) Electropherogram of the contents of a single cell loaded with cFL and K-FAM. Time since peptide loading was < 30 min for all traces. The time axis of each trace was normalized to the migration time of the internal standard for (b), and y-values of traces (b) and (c) were multiplied by 25 and 150, respectively. (d) Percent of total fragment peak area in peak 1 as a function of total fragment peak area for n = 99 untreated cells.

