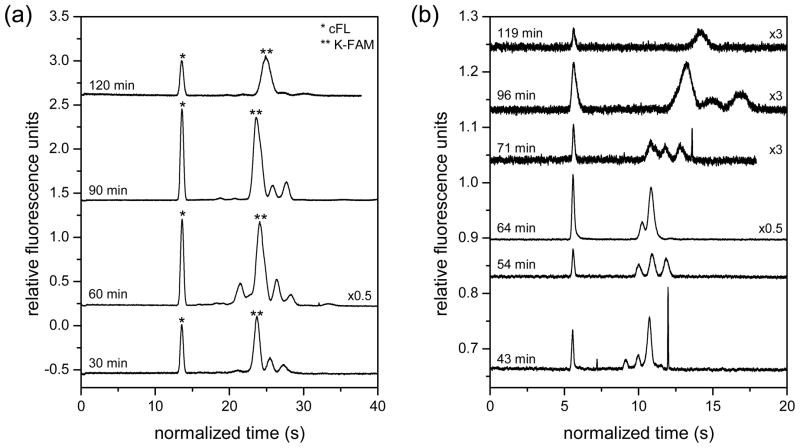
Figure 3.
Electropherograms for (a) lysate from 107 cells and (b) single cells treated with Tosedostat and lysed at various time points after peptide loading. The first peak in each electropherogram was the internal standard, carboxyfluorescein, and the time axis of each trace was normalized to the migration time of the internal standard for the first trace.

